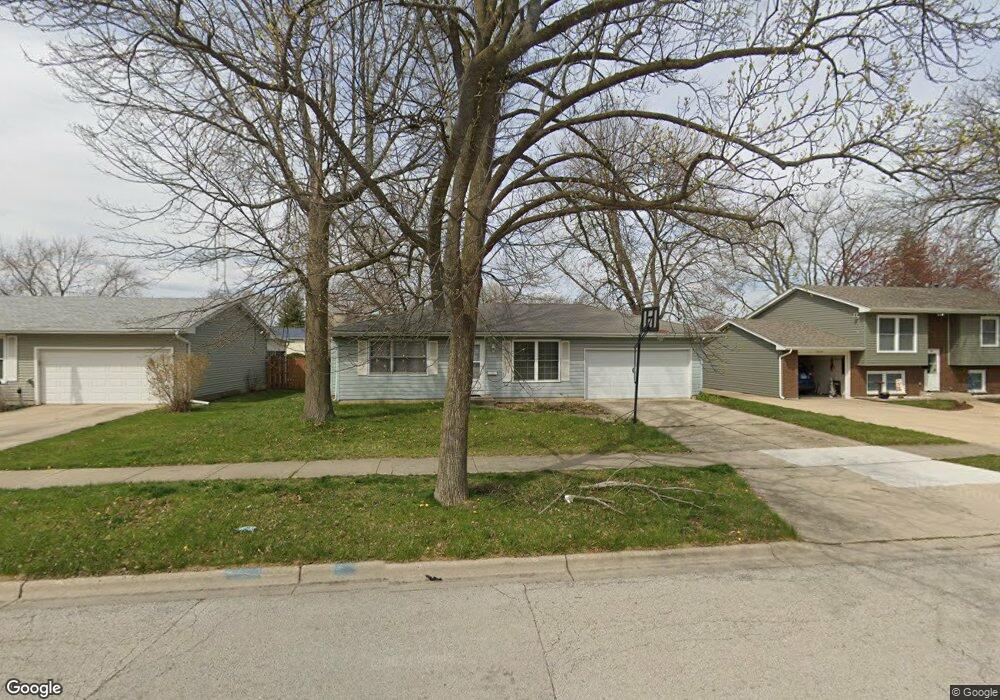
2069 Bradford Ln Aurora, IL 60506
Edgelawn Randall NeighborhoodEstimated Value: $329,770 - $345,000
3
Beds
2
Baths
1,500
Sq Ft
$224/Sq Ft
Est. Value
About This Home
This home is located at 2069 Bradford Ln, Aurora, IL 60506 and is currently estimated at $335,943, approximately $223 per square foot. 2069 Bradford Ln is a home located in Kane County with nearby schools including Hall Elementary School, Jefferson Middle School, and West Aurora High School.
Ownership History
Date
Name
Owned For
Owner Type
Purchase Details
Closed on
Oct 14, 2008
Sold by
Obrien Charles L and Obrien Stacey M
Bought by
Eddy Daniel S
Current Estimated Value
Home Financials for this Owner
Home Financials are based on the most recent Mortgage that was taken out on this home.
Original Mortgage
$191,810
Outstanding Balance
$124,511
Interest Rate
5.94%
Mortgage Type
FHA
Estimated Equity
$211,432
Purchase Details
Closed on
Sep 10, 2002
Sold by
Obrien Charles L
Bought by
Obrien Charles L and Obrien Stacey M
Home Financials for this Owner
Home Financials are based on the most recent Mortgage that was taken out on this home.
Original Mortgage
$106,000
Interest Rate
5.62%
Purchase Details
Closed on
Apr 23, 1998
Sold by
Hud
Bought by
Obrien Charles L
Home Financials for this Owner
Home Financials are based on the most recent Mortgage that was taken out on this home.
Original Mortgage
$109,250
Interest Rate
7.18%
Purchase Details
Closed on
Jun 6, 1997
Sold by
Ramsey Kenneth
Bought by
Hud
Create a Home Valuation Report for This Property
The Home Valuation Report is an in-depth analysis detailing your home's value as well as a comparison with similar homes in the area
Home Values in the Area
Average Home Value in this Area
Purchase History
| Date | Buyer | Sale Price | Title Company |
|---|---|---|---|
| Eddy Daniel S | -- | First American Title | |
| Obrien Charles L | -- | Chicago Title Insurance Co | |
| Obrien Charles L | -- | Stewart Title Company | |
| Hud | -- | -- |
Source: Public Records
Mortgage History
| Date | Status | Borrower | Loan Amount |
|---|---|---|---|
| Open | Eddy Daniel S | $191,810 | |
| Previous Owner | Obrien Charles L | $106,000 | |
| Previous Owner | Obrien Charles L | $109,250 |
Source: Public Records
Tax History
| Year | Tax Paid | Tax Assessment Tax Assessment Total Assessment is a certain percentage of the fair market value that is determined by local assessors to be the total taxable value of land and additions on the property. | Land | Improvement |
|---|---|---|---|---|
| 2024 | $7,046 | $88,984 | $13,260 | $75,724 |
| 2023 | $6,810 | $79,507 | $11,848 | $67,659 |
| 2022 | $6,242 | $70,515 | $10,810 | $59,705 |
| 2021 | $5,998 | $65,650 | $10,064 | $55,586 |
| 2020 | $6,371 | $68,055 | $9,348 | $58,707 |
| 2019 | $6,597 | $67,466 | $8,661 | $58,805 |
| 2018 | $6,038 | $60,485 | $8,011 | $52,474 |
| 2017 | $5,984 | $58,146 | $7,381 | $50,765 |
| 2016 | $5,301 | $49,903 | $6,327 | $43,576 |
| 2015 | -- | $43,583 | $5,441 | $38,142 |
| 2014 | -- | $41,917 | $5,233 | $36,684 |
| 2013 | -- | $41,320 | $5,158 | $36,162 |
Source: Public Records
Map
Nearby Homes
- 1071 Almond Dr
- 2220 Mayflower St
- 873 Shady Ln
- 1930 Sapphire Ln
- 980 Sapphire Ln
- 968 Sapphire Ln
- 960 Sapphire Ln
- 972 Sapphire Ln
- 988 Sapphire Ln
- 976 Sapphire Ln
- 984 Sapphire Ln
- 991 Sapphire Ln
- 959 Sapphire Ln
- 975 Sapphire Ln
- 963 Sapphire Ln
- 987 Sapphire Ln
- 983 Sapphire Ln
- 2416 Courtyard Cir Unit 2
- 735 Westgate Dr
- 1734 Rosedale Ct
- 2059 Bradford Ln
- 2079 Bradford Ln
- 2130 Charleston Dr
- 2055 Bradford Ln
- 2120 Charleston Dr
- 2083 Bradford Ln Unit 1
- 2140 Charleston Dr
- 2058 Bradford Ln Unit 1
- 2150 Charleston Dr
- 2074 Bradford Ln
- 2161 Bradford Ln
- 2051 Bradford Ln
- 896 Laurel Dr
- 2084 Bradford Ln
- 2160 Charleston Dr
- 873 Hermitage Dr
- 2050 Bradford Ln
- 2052 Charleston Dr
- 820 Hermitage Dr
Your Personal Tour Guide
Ask me questions while you tour the home.