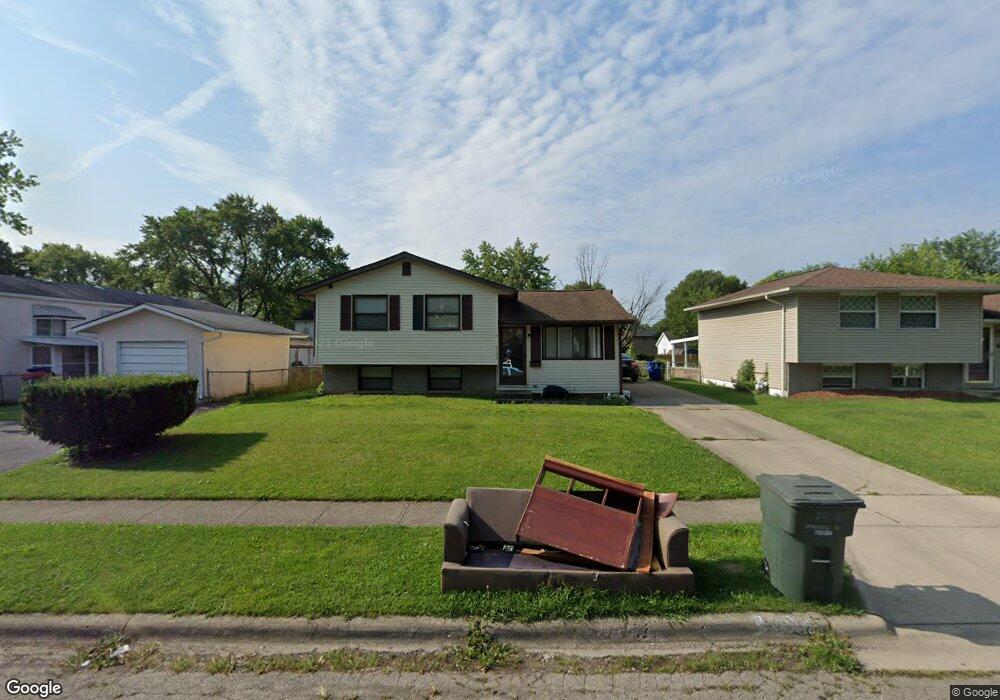
2069 Brookfield Rd Columbus, OH 43229
Forest Park East NeighborhoodEstimated Value: $241,737 - $263,000
3
Beds
2
Baths
1,444
Sq Ft
$174/Sq Ft
Est. Value
About This Home
This home is located at 2069 Brookfield Rd, Columbus, OH 43229 and is currently estimated at $251,684, approximately $174 per square foot. 2069 Brookfield Rd is a home located in Franklin County with nearby schools including Forest Park Elementary School, Woodward Park Middle School, and Northland High School.
Ownership History
Date
Name
Owned For
Owner Type
Purchase Details
Closed on
Jan 12, 2012
Sold by
Kaylor Richard and Kaylor Sandra
Bought by
Salazar Adriana G
Current Estimated Value
Purchase Details
Closed on
Feb 18, 2010
Sold by
Fifth Third Mortgage Company
Bought by
Kaylor Richard
Purchase Details
Closed on
Jan 20, 2010
Sold by
Whiteside Robin L and Case #08 Cve 04 6166
Bought by
Fifth Third Mortgage Company
Purchase Details
Closed on
Sep 19, 2003
Sold by
Peebles Crystal and Peebles Michael
Bought by
Whiteside Robin L
Home Financials for this Owner
Home Financials are based on the most recent Mortgage that was taken out on this home.
Original Mortgage
$126,000
Interest Rate
6.4%
Mortgage Type
Purchase Money Mortgage
Purchase Details
Closed on
Nov 9, 1987
Bought by
Daniel Crystal
Purchase Details
Closed on
Jun 1, 1979
Create a Home Valuation Report for This Property
The Home Valuation Report is an in-depth analysis detailing your home's value as well as a comparison with similar homes in the area
Home Values in the Area
Average Home Value in this Area
Purchase History
| Date | Buyer | Sale Price | Title Company |
|---|---|---|---|
| Salazar Adriana G | $105,000 | Attorney | |
| Kaylor Richard | $62,500 | Fidelity Land Title Agency | |
| Fifth Third Mortgage Company | $70,000 | Attorney | |
| Whiteside Robin L | $126,000 | Chicago Title | |
| Daniel Crystal | -- | -- | |
| -- | $43,900 | -- |
Source: Public Records
Mortgage History
| Date | Status | Borrower | Loan Amount |
|---|---|---|---|
| Previous Owner | Whiteside Robin L | $126,000 |
Source: Public Records
Tax History
| Year | Tax Paid | Tax Assessment Tax Assessment Total Assessment is a certain percentage of the fair market value that is determined by local assessors to be the total taxable value of land and additions on the property. | Land | Improvement |
|---|---|---|---|---|
| 2025 | $6,047 | $66,160 | $16,630 | $49,530 |
| 2024 | $6,047 | $66,160 | $16,630 | $49,530 |
| 2023 | $3,115 | $66,150 | $16,625 | $49,525 |
| 2022 | $6,470 | $49,850 | $10,610 | $39,240 |
| 2021 | $2,743 | $49,850 | $10,610 | $39,240 |
| 2020 | $2,593 | $49,850 | $10,610 | $39,240 |
| 2019 | $2,263 | $37,310 | $7,840 | $29,470 |
| 2018 | $2,161 | $37,310 | $7,840 | $29,470 |
| 2017 | $2,262 | $37,310 | $7,840 | $29,470 |
| 2016 | $2,273 | $34,310 | $7,390 | $26,920 |
| 2015 | $2,063 | $34,310 | $7,390 | $26,920 |
| 2014 | $2,068 | $34,310 | $7,390 | $26,920 |
| 2013 | $1,073 | $36,085 | $7,770 | $28,315 |
Source: Public Records
Map
Nearby Homes
- 2027 Shawbury Ct W
- 5603 Maple Canyon Ave
- 2087 Teakwood Dr
- 5726 Beechcroft Rd Unit J
- 5732 Beechcroft Rd Unit B
- 5720 Beechcroft Rd Unit B
- 1862 Torchwood Dr
- 5556 Parkshire Dr Unit 5556
- 5705 Pine Tree St S Unit F
- 1687 Brookfield Square S
- 5177 Avalon Ave
- 5885 Beechcroft Rd Unit 306
- 5885 Beechcroft Rd Unit 114
- 5972 Maple Canyon Ave
- 2251 Tuliptree Ave
- 1638 Arrowood Loop N
- 1523 Hempwood Dr
- 5092 Riverbirch Dr N
- 5524 Driftwood Rd
- 5352 Hazelwood Rd
- 2061 Brookfield Rd
- 2077 Brookfield Rd
- 2053 Brookfield Rd
- 5535 Maple Canyon Ave
- 2064 Sumac Dr
- 2054 Sumac Dr
- 2070 Brookfield Rd
- 2062 Brookfield Rd
- 2076 Brookfield Rd
- 2056 Brookfield Rd
- 2046 Sumac Dr
- 5523 Maple Canyon Ave
- 2039 Brookfield Rd
- 2048 Brookfield Rd
- 5536 Maple Canyon Ave
- 2103-2105 Brookfield Rd
- 2103 Brookfield Rd Unit 105
- 5528 Maple Canyon Ave
- 2038 Sumac Dr
- 2040 Brookfield Rd
Your Personal Tour Guide
Ask me questions while you tour the home.