J
Landlord's Agent in 2016
J. B. Shrader
Shrader Realty & Assoc.
(928) 920-3385
2 Total Sales
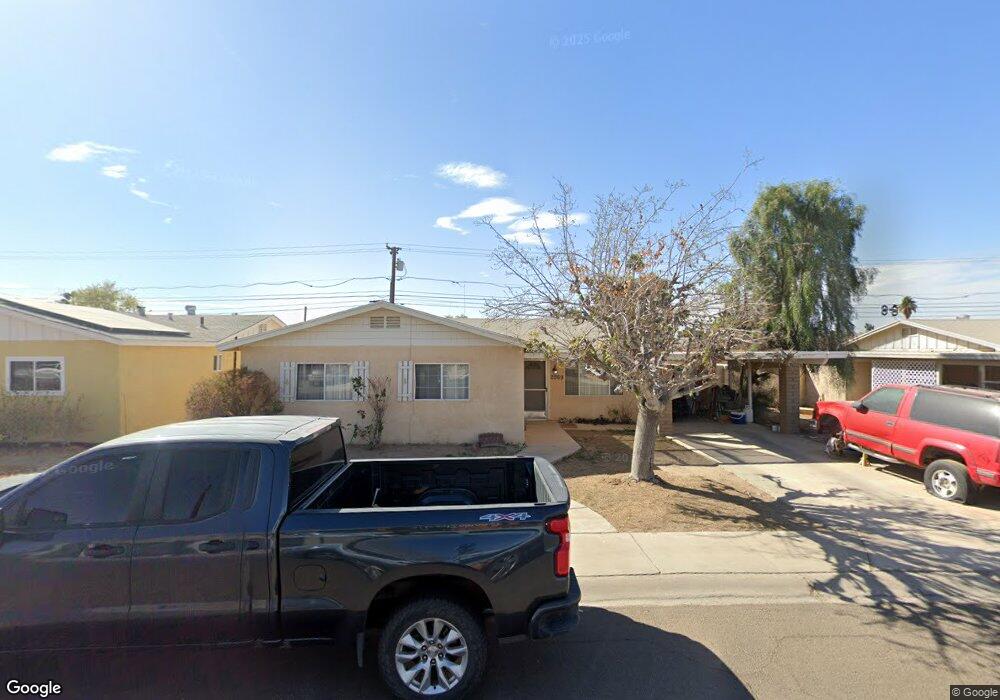

Estimated Value: $200,000 - $241,000
Please call Cynthia Shrader to see this great rental property!
Last Agent to Rent the Property
Shrader Realty & Assoc. License #BR037150000 Listed on: 01/25/2016
| Date | Buyer | Sale Price | Title Company |
|---|---|---|---|
| Shrader Jd | $89,000 | Chicago Title | |
| Jongeward John H | -- | None Available |
| Date | Event | Price | List to Sale | Price per Sq Ft | Prior Sale |
|---|---|---|---|---|---|
| 03/01/2016 03/01/16 | Under Contract | -- | -- | -- | |
| 02/02/2016 02/02/16 | Rented | $800 | 0.0% | -- | |
| 01/25/2016 01/25/16 | For Rent | $800 | 0.0% | -- | |
| 01/25/2016 01/25/16 | Rented | $800 | 0.0% | -- | |
| 02/02/2015 02/02/15 | Under Contract | -- | -- | -- | |
| 01/07/2015 01/07/15 | For Rent | $800 | 0.0% | -- | |
| 11/05/2013 11/05/13 | Sold | $89,000 | 0.0% | $61 / Sq Ft | View Prior Sale |
| 10/24/2013 10/24/13 | Pending | -- | -- | -- | |
| 10/23/2013 10/23/13 | For Sale | $89,000 | -- | $61 / Sq Ft |
| Year | Tax Paid | Tax Assessment Tax Assessment Total Assessment is a certain percentage of the fair market value that is determined by local assessors to be the total taxable value of land and additions on the property. | Land | Improvement |
|---|---|---|---|---|
| 2026 | $1,398 | $11,185 | $3,931 | $7,254 |
| 2025 | $1,355 | $10,653 | $2,189 | $8,464 |
| 2024 | $1,308 | $10,145 | $2,115 | $8,030 |
| 2023 | $1,308 | $9,662 | $2,081 | $7,581 |
| 2022 | $1,269 | $9,202 | $2,009 | $7,193 |
| 2021 | $1,320 | $8,763 | $1,901 | $6,862 |
| 2020 | $1,211 | $8,347 | $1,919 | $6,428 |
| 2019 | $1,191 | $7,949 | $2,130 | $5,819 |
| 2018 | $1,142 | $7,571 | $2,095 | $5,476 |
| 2017 | $1,099 | $7,571 | $2,095 | $5,476 |
| 2016 | $1,117 | $6,866 | $1,793 | $5,073 |
| 2015 | $911 | $6,540 | $1,775 | $4,765 |
| 2014 | $911 | $6,228 | $1,542 | $4,686 |
J
Landlord's Agent in 2016
J. B. Shrader
Shrader Realty & Assoc.
(928) 920-3385
2 Total Sales
C
Landlord's Co-Listing Agent in 2016
Cynthia Shrader
Shrader Realty & Assoc.
(928) 920-3074
31 Total Sales

Seller's Agent in 2013
Donna White
CENTURY 21 Action Group Fthl
(928) 920-7578
162 Total Sales
Source: Yuma Association of REALTORS®
MLS Number: 120188
APN: 695-08-025
Disclaimer: Certain information contained herein is derived from information provided by parties other than Homes.com. All information provided is deemed reliable, but is not guaranteed to be accurate and should be independently verified.
![]() IDX information is provided exclusively for personal, non-commercial use, and may not be used for any purpose other than to identify prospective properties consumers may be interested in purchasing. Information is deemed reliable but not guaranteed.
IDX information is provided exclusively for personal, non-commercial use, and may not be used for any purpose other than to identify prospective properties consumers may be interested in purchasing. Information is deemed reliable but not guaranteed.
Ask me questions while you tour the home.