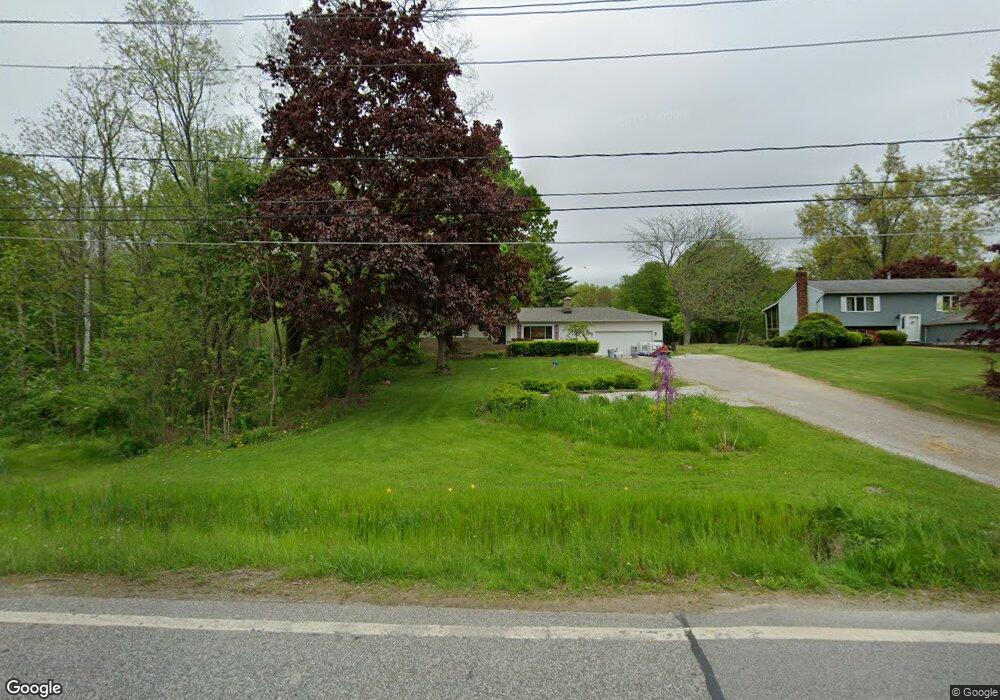
2069 Mcmackin Rd Madison, OH 44057
Estimated Value: $238,000 - $280,925
3
Beds
2
Baths
1,497
Sq Ft
$169/Sq Ft
Est. Value
About This Home
This home is located at 2069 Mcmackin Rd, Madison, OH 44057 and is currently estimated at $252,481, approximately $168 per square foot. 2069 Mcmackin Rd is a home located in Lake County with nearby schools including South Elementary School, Madison Middle School, and Madison High School.
Ownership History
Date
Name
Owned For
Owner Type
Purchase Details
Closed on
May 9, 2011
Sold by
Hsbc Mortgage Services Inc
Bought by
Jeschelnig Timothy
Current Estimated Value
Home Financials for this Owner
Home Financials are based on the most recent Mortgage that was taken out on this home.
Original Mortgage
$104,555
Interest Rate
5.5%
Mortgage Type
FHA
Purchase Details
Closed on
Feb 11, 2011
Sold by
Faudree Miriam A and Case #09 Cf 002733
Bought by
Hsbc Mortgage Services Inc
Purchase Details
Closed on
Mar 13, 2002
Sold by
Faudree William G and Faudree Miriam A
Bought by
Faudree Miriam A
Purchase Details
Closed on
Jun 9, 1999
Sold by
Hayden Robert B and Hayden Sharon L
Bought by
Faudree William G and Faudree Miriam A
Home Financials for this Owner
Home Financials are based on the most recent Mortgage that was taken out on this home.
Original Mortgage
$85,000
Interest Rate
7.15%
Purchase Details
Closed on
Jun 11, 1990
Bought by
Mazure Frank P
Create a Home Valuation Report for This Property
The Home Valuation Report is an in-depth analysis detailing your home's value as well as a comparison with similar homes in the area
Home Values in the Area
Average Home Value in this Area
Purchase History
| Date | Buyer | Sale Price | Title Company |
|---|---|---|---|
| Jeschelnig Timothy | $90,000 | Attorney | |
| Hsbc Mortgage Services Inc | $96,000 | None Available | |
| Faudree Miriam A | -- | -- | |
| Faudree William G | $181,000 | Bates Title Corp | |
| Mazure Frank P | $105,000 | -- |
Source: Public Records
Mortgage History
| Date | Status | Borrower | Loan Amount |
|---|---|---|---|
| Previous Owner | Jeschelnig Timothy | $104,555 | |
| Previous Owner | Faudree William G | $85,000 |
Source: Public Records
Tax History Compared to Growth
Tax History
| Year | Tax Paid | Tax Assessment Tax Assessment Total Assessment is a certain percentage of the fair market value that is determined by local assessors to be the total taxable value of land and additions on the property. | Land | Improvement |
|---|---|---|---|---|
| 2024 | $2,350 | $91,540 | $27,560 | $63,980 |
| 2023 | $2,350 | $62,120 | $23,660 | $38,460 |
| 2022 | $4,239 | $62,120 | $23,660 | $38,460 |
| 2021 | $4,245 | $62,120 | $23,660 | $38,460 |
| 2020 | $4,156 | $53,550 | $20,390 | $33,160 |
| 2019 | $4,159 | $53,550 | $20,390 | $33,160 |
| 2018 | $4,035 | $39,530 | $16,340 | $23,190 |
| 2017 | $3,174 | $39,530 | $16,340 | $23,190 |
| 2016 | $2,920 | $39,530 | $16,340 | $23,190 |
| 2015 | $2,373 | $39,530 | $16,340 | $23,190 |
| 2014 | $2,427 | $39,530 | $16,340 | $23,190 |
| 2013 | $2,432 | $39,530 | $16,340 | $23,190 |
Source: Public Records
Map
Nearby Homes
- 5554 Saint Thomas Ln Unit 38
- 5727 Heritage Ave
- 1944 W Tuttle Park Rd
- 1837 Haines Rd
- 5247 Lockwood Rd
- S/L 26 Old Mill Rd
- 2134 Old Mill Rd
- 0 Townline Rd Unit 5102752
- 5742 Abiding Way
- 1938 Green Rd
- 0 Mcmackin Rd Unit 5102732
- 6046 Dundee St
- 0 Green Rd Unit 4151112
- 1775 Green Rd
- 6081 Douglas Dr
- 1832 Meadows Rd
- V/L Townline Rd
- 0 Maxwell Dr
- 0 N Ridge (Us Rt 20) Rd Unit 4151016
- 6242 Maxwell Dr
- 2085 Mcmackin Rd
- 2097 Mcmackin Rd
- 2074 Mcmackin Rd
- 2046 Mcmackin Rd
- 2128 Mcmackin Rd
- 2137 Mcmackin Rd
- 2134 Mcmackin Rd
- 5464 Chapel Rd
- 5494 Chapel Rd
- 2140 Mcmackin Rd
- 2150 Mcmackin Rd
- 5518 Chapel Rd
- 5446 Chapel Rd
- 5438 Chapel Rd
- 5438 Chapel Road Extension
- 5465 Chapel Rd
- 5451 Chapel Rd
- 5451 Chapel Road Extension
- 5610 Saint Thomas Ln
- 5477 Chapel Rd