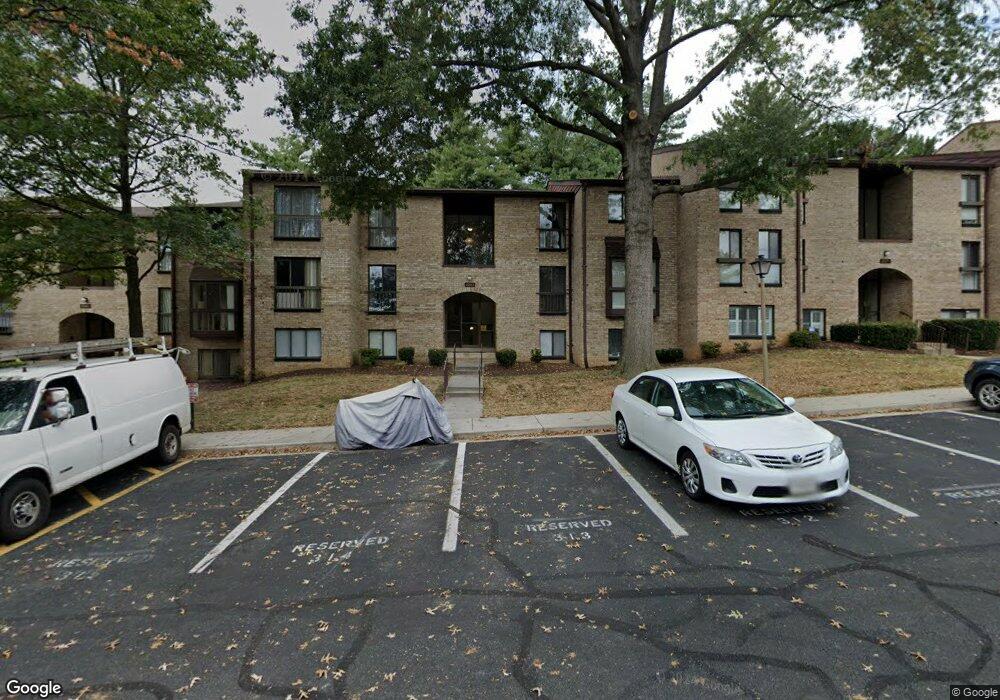
2069 Royal Fern Ct Unit 36/11B Reston, VA 20191
Estimated Value: $308,000
2
Beds
1
Bath
1,068
Sq Ft
$288/Sq Ft
Est. Value
About This Home
This home is located at 2069 Royal Fern Ct Unit 36/11B, Reston, VA 20191 and is currently estimated at $308,000, approximately $288 per square foot. 2069 Royal Fern Ct Unit 36/11B is a home located in Fairfax County with nearby schools including Dogwood Elementary, South Lakes High School, and Al Fatih Academy.
Ownership History
Date
Name
Owned For
Owner Type
Purchase Details
Closed on
Aug 27, 2021
Sold by
Singhal Naveen and Singhal Manisha
Bought by
Singhal Naveen and Naveen Singhal Revocable Trust
Current Estimated Value
Purchase Details
Closed on
Dec 8, 2009
Sold by
Deutsche Bank National Trust
Bought by
Singhal Naveen
Home Financials for this Owner
Home Financials are based on the most recent Mortgage that was taken out on this home.
Original Mortgage
$68,000
Interest Rate
5.05%
Mortgage Type
Purchase Money Mortgage
Purchase Details
Closed on
Apr 30, 2003
Sold by
Marr Russell
Bought by
Eastham Aysim S
Home Financials for this Owner
Home Financials are based on the most recent Mortgage that was taken out on this home.
Original Mortgage
$115,000
Interest Rate
5.82%
Mortgage Type
Purchase Money Mortgage
Create a Home Valuation Report for This Property
The Home Valuation Report is an in-depth analysis detailing your home's value as well as a comparison with similar homes in the area
Home Values in the Area
Average Home Value in this Area
Purchase History
| Date | Buyer | Sale Price | Title Company |
|---|---|---|---|
| Singhal Naveen | -- | None Available | |
| Singhal Naveen | $143,000 | -- | |
| Eastham Aysim S | $135,000 | -- |
Source: Public Records
Mortgage History
| Date | Status | Borrower | Loan Amount |
|---|---|---|---|
| Previous Owner | Singhal Naveen | $68,000 | |
| Previous Owner | Eastham Aysim S | $115,000 |
Source: Public Records
Tax History Compared to Growth
Tax History
| Year | Tax Paid | Tax Assessment Tax Assessment Total Assessment is a certain percentage of the fair market value that is determined by local assessors to be the total taxable value of land and additions on the property. | Land | Improvement |
|---|---|---|---|---|
| 2025 | $3,403 | $290,780 | $58,000 | $232,780 |
| 2024 | $3,403 | $282,310 | $56,000 | $226,310 |
| 2023 | $3,073 | $261,400 | $52,000 | $209,400 |
| 2022 | $2,779 | $233,390 | $47,000 | $186,390 |
| 2021 | $2,739 | $224,410 | $45,000 | $179,410 |
| 2020 | $2,605 | $211,710 | $42,000 | $169,710 |
| 2019 | $2,605 | $211,710 | $43,000 | $168,710 |
| 2018 | $2,113 | $183,700 | $37,000 | $146,700 |
| 2017 | $2,219 | $183,700 | $37,000 | $146,700 |
| 2016 | $2,291 | $190,020 | $38,000 | $152,020 |
| 2015 | $2,210 | $190,020 | $38,000 | $152,020 |
| 2014 | $1,866 | $160,830 | $32,000 | $128,830 |
Source: Public Records
Map
Nearby Homes
- 2065 Royal Fern Ct Unit 38/12B
- 2042 Royal Fern Ct Unit 1B
- 2058 Royal Fern Ct Unit 26/1C
- 2394 Southgate Square
- 2203 Hunters Run Dr
- 2142 Cartwright Place
- 2273 Hunters Run Dr
- 11908 Barrel Cooper Ct
- 11879 Barrel Cooper Ct
- 11817 Coopers Ct
- 11824 Breton Ct Unit 24A
- 11808 Breton Ct Unit 12C
- 2418 Ridgehampton Ct
- 11608 Newbridge Ct
- 11770 Sunrise Valley Dr Unit 321
- 11770 Sunrise Valley Dr Unit 120
- 11813 Breton Ct Unit 1A
- 11760 Sunrise Valley Dr Unit 809
- 11837 Shire Ct Unit 22C
- 11695 Sunrise Square Place
- 2069 Royal Fern Ct Unit 2B
- 2069 Royal Fern Ct Unit 36/1B
- 2069 Royal Fern Ct Unit 11B
- 2069 Royal Fern Ct Unit 1B
- 2069 Royal Fern Ct Unit 12B
- 2069 Royal Fern Ct Unit 11B
- 2071 Royal Fern Ct Unit 11B
- 2071 Royal Fern Ct Unit 21B
- 2071 Royal Fern Ct Unit 2B
- 2067 Royal Fern Ct Unit 37/12B
- 2067 Royal Fern Ct Unit 2B
- 2067 Royal Fern Ct Unit 37/2B
- 2073 Royal Fern Ct Unit 21B
- 2073 Royal Fern Ct Unit 34/2C
- 2073 Royal Fern Ct Unit 34/22C
- 2073 Royal Fern Ct Unit 1B
- 2073 Royal Fern Ct Unit 2C
- 2073 Royal Fern Ct Unit 22C
- 2073 Royal Fern Ct Unit 11B
- 2065 Royal Fern Ct Unit 2B