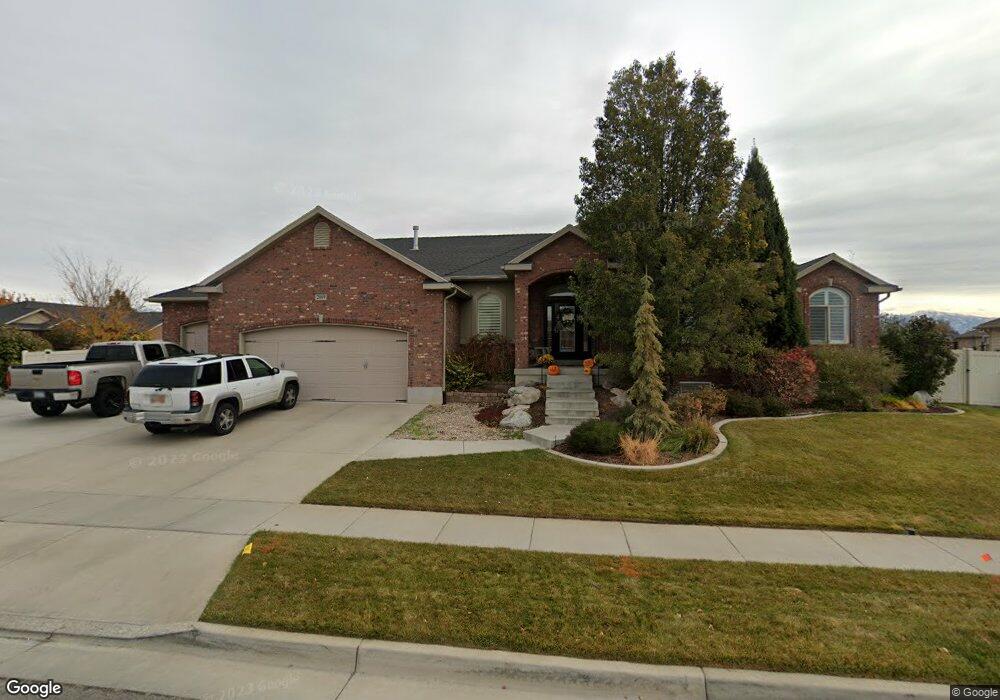
2069 S 1475 W Syracuse, UT 84075
Estimated Value: $649,000 - $772,084
--
Bed
3
Baths
2,088
Sq Ft
$345/Sq Ft
Est. Value
About This Home
This home is located at 2069 S 1475 W, Syracuse, UT 84075 and is currently estimated at $720,021, approximately $344 per square foot. 2069 S 1475 W is a home located in Davis County with nearby schools including Cook School, Legacy Junior High School, and Clearfield High School.
Ownership History
Date
Name
Owned For
Owner Type
Purchase Details
Closed on
Nov 7, 2006
Sold by
Anderson Kenneth L
Bought by
Younger James W and Younger Laurie K
Current Estimated Value
Home Financials for this Owner
Home Financials are based on the most recent Mortgage that was taken out on this home.
Original Mortgage
$259,200
Outstanding Balance
$153,298
Interest Rate
6.3%
Mortgage Type
Purchase Money Mortgage
Estimated Equity
$566,723
Purchase Details
Closed on
Jan 12, 2006
Sold by
Thr Investments Llc
Bought by
Anderson Kenneth L
Home Financials for this Owner
Home Financials are based on the most recent Mortgage that was taken out on this home.
Original Mortgage
$50,800
Interest Rate
6.25%
Mortgage Type
Purchase Money Mortgage
Create a Home Valuation Report for This Property
The Home Valuation Report is an in-depth analysis detailing your home's value as well as a comparison with similar homes in the area
Home Values in the Area
Average Home Value in this Area
Purchase History
| Date | Buyer | Sale Price | Title Company |
|---|---|---|---|
| Younger James W | -- | Security Title | |
| Anderson Kenneth L | -- | Bonneville Title Company |
Source: Public Records
Mortgage History
| Date | Status | Borrower | Loan Amount |
|---|---|---|---|
| Open | Younger James W | $259,200 | |
| Previous Owner | Anderson Kenneth L | $50,800 |
Source: Public Records
Tax History Compared to Growth
Tax History
| Year | Tax Paid | Tax Assessment Tax Assessment Total Assessment is a certain percentage of the fair market value that is determined by local assessors to be the total taxable value of land and additions on the property. | Land | Improvement |
|---|---|---|---|---|
| 2025 | $4,144 | $399,850 | $121,555 | $278,295 |
| 2024 | $3,913 | $380,050 | $103,300 | $276,750 |
| 2023 | $3,684 | $652,000 | $143,776 | $508,224 |
| 2022 | $3,894 | $377,850 | $82,379 | $295,471 |
| 2021 | $3,469 | $521,000 | $122,055 | $398,945 |
| 2020 | $3,108 | $452,000 | $104,930 | $347,070 |
| 2019 | $2,981 | $428,000 | $104,271 | $323,729 |
| 2018 | $2,793 | $398,000 | $99,783 | $298,217 |
| 2016 | $2,634 | $196,845 | $38,236 | $158,609 |
| 2015 | $2,665 | $189,640 | $38,236 | $151,404 |
| 2014 | $2,274 | $164,897 | $38,236 | $126,661 |
| 2013 | -- | $189,888 | $40,423 | $149,465 |
Source: Public Records
Map
Nearby Homes