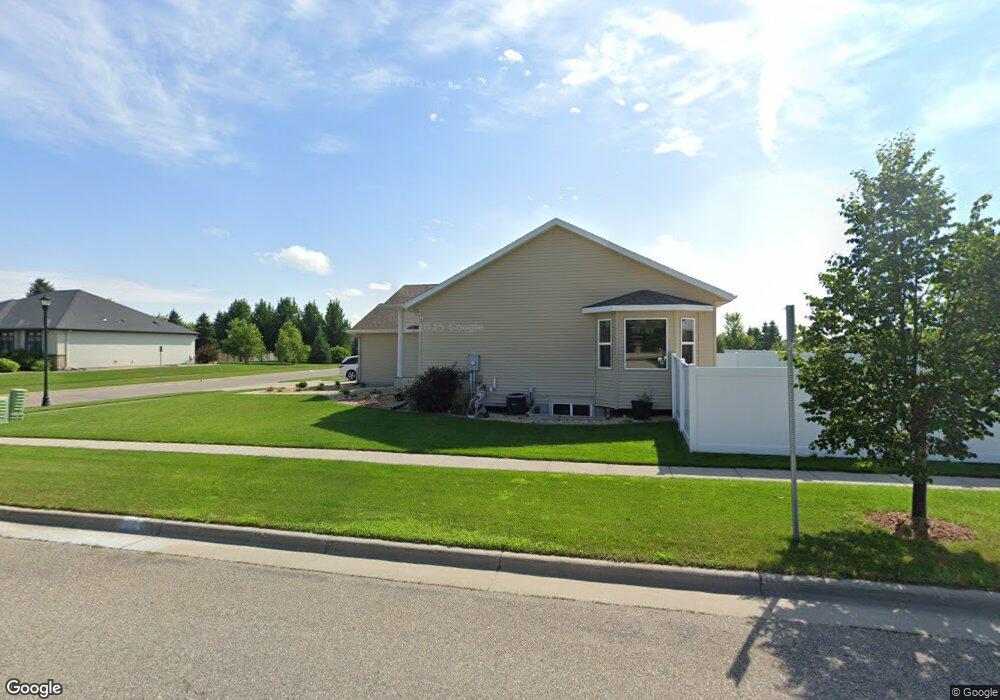
207 39th Ave E West Fargo, ND 58078
Osgood NeighborhoodEstimated Value: $445,000 - $504,537
5
Beds
3
Baths
3,204
Sq Ft
$148/Sq Ft
Est. Value
About This Home
This home is located at 207 39th Ave E, West Fargo, ND 58078 and is currently estimated at $474,769, approximately $148 per square foot. 207 39th Ave E is a home located in Cass County with nearby schools including Aurora Elementary School, Liberty Middle School, and West Fargo Sheyenne High School.
Ownership History
Date
Name
Owned For
Owner Type
Purchase Details
Closed on
Feb 21, 2020
Sold by
Zimny Matthew and Zimny Amber
Bought by
Schaffer Reanna B and Schaffer Corey M
Current Estimated Value
Home Financials for this Owner
Home Financials are based on the most recent Mortgage that was taken out on this home.
Original Mortgage
$306,000
Outstanding Balance
$270,942
Interest Rate
3.6%
Mortgage Type
New Conventional
Estimated Equity
$203,827
Purchase Details
Closed on
Mar 9, 2015
Sold by
Vaux Mark C and Vaux Dawn R
Bought by
Zimmy Matthew
Home Financials for this Owner
Home Financials are based on the most recent Mortgage that was taken out on this home.
Original Mortgage
$357,934
Interest Rate
3.56%
Mortgage Type
VA
Purchase Details
Closed on
Apr 19, 2012
Sold by
Heritage Homes Llc
Bought by
Vaux Mark C and Vaux Dawn R
Home Financials for this Owner
Home Financials are based on the most recent Mortgage that was taken out on this home.
Original Mortgage
$208,850
Interest Rate
3.12%
Mortgage Type
Adjustable Rate Mortgage/ARM
Create a Home Valuation Report for This Property
The Home Valuation Report is an in-depth analysis detailing your home's value as well as a comparison with similar homes in the area
Home Values in the Area
Average Home Value in this Area
Purchase History
| Date | Buyer | Sale Price | Title Company |
|---|---|---|---|
| Schaffer Reanna B | $340,000 | Title Co | |
| Zimmy Matthew | $346,500 | None Available | |
| Vaux Mark C | $278,500 | Title Co |
Source: Public Records
Mortgage History
| Date | Status | Borrower | Loan Amount |
|---|---|---|---|
| Open | Schaffer Reanna B | $306,000 | |
| Previous Owner | Zimmy Matthew | $357,934 | |
| Previous Owner | Vaux Mark C | $208,850 |
Source: Public Records
Tax History Compared to Growth
Tax History
| Year | Tax Paid | Tax Assessment Tax Assessment Total Assessment is a certain percentage of the fair market value that is determined by local assessors to be the total taxable value of land and additions on the property. | Land | Improvement |
|---|---|---|---|---|
| 2024 | $7,540 | $232,100 | $44,200 | $187,900 |
| 2023 | $8,992 | $216,250 | $44,200 | $172,050 |
| 2022 | $8,939 | $202,000 | $44,200 | $157,800 |
| 2021 | $8,725 | $187,400 | $35,350 | $152,050 |
| 2020 | $8,705 | $186,200 | $35,350 | $150,850 |
| 2019 | $9,127 | $195,600 | $35,350 | $160,250 |
| 2018 | $9,173 | $198,950 | $35,350 | $163,600 |
| 2017 | $9,120 | $200,650 | $35,350 | $165,300 |
| 2016 | $8,413 | $196,050 | $35,350 | $160,700 |
| 2015 | $7,489 | $153,750 | $25,800 | $127,950 |
| 2014 | $5,466 | $143,700 | $25,800 | $117,900 |
| 2013 | $5,380 | $62,550 | $25,800 | $36,750 |
Source: Public Records
Map
Nearby Homes
- 6511 Osgood Pkwy S
- 3830 3rd St E
- 421 Westview Ln E
- 414 Westview Ln E
- 3755 Houkom Dr E
- 4337 66th St S
- 522 Westview Ln E
- 4355 66th St S
- 3784 Bell Blvd E
- 3767 Bell Blvd E
- 6976 65th St S
- 7108 65th St S
- 7018 65th St S
- 6965 65th St S
- 6977 65th St S
- 6988 65th St S
- 7114 65th St S
- 6970 65th St S
- 6971 65th St S
- 7024 65th St S
- 215 39th Ave E
- 223 39th Ave E
- 3881 7 1/2 St E
- 6602 40th Ave S
- 231 39th Ave E
- 3873 7 1/2 St E
- 3878 3rd St E
- 3811 66th St S
- 3911 66th St S
- 3874 2nd St E
- 6587 Osgood Pkwy S
- 6561 Osgood Pkwy S
- 239 39th Ave E
- 3930 2nd St E
- 4051 66th St S
- 6537 Osgood Pkwy S
- 3870 3rd St E
- 3930 7 1/2 St E
- 3866 2nd St E
- 3865 2nd St E