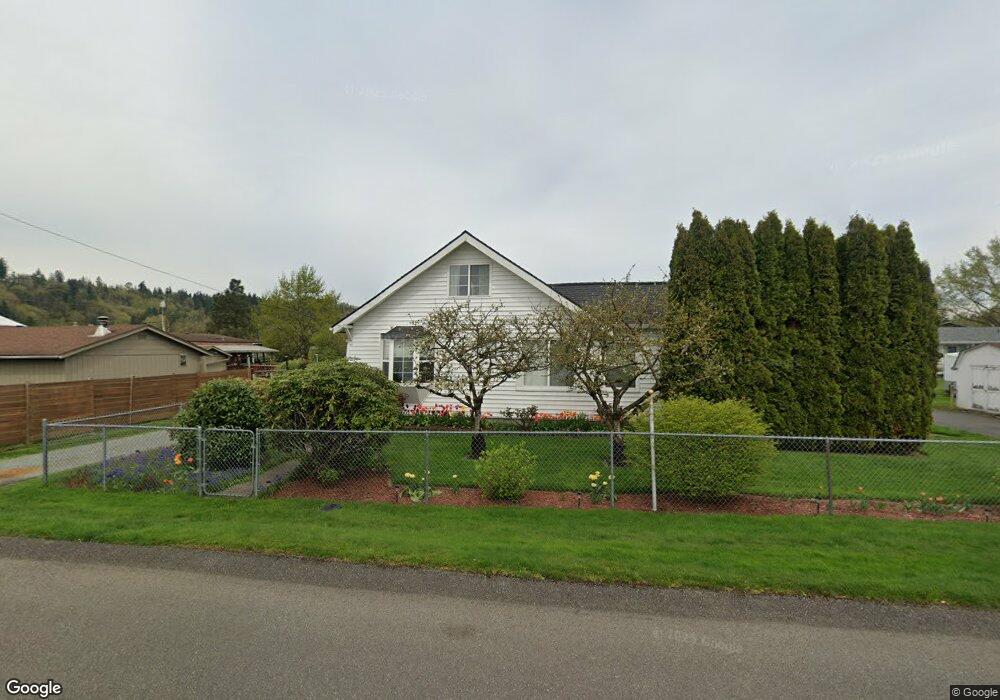
207 9th Ave N Algona, WA 98001
Estimated Value: $379,000 - $434,000
2
Beds
1
Bath
1,030
Sq Ft
$400/Sq Ft
Est. Value
About This Home
This home is located at 207 9th Ave N, Algona, WA 98001 and is currently estimated at $412,328, approximately $400 per square foot. 207 9th Ave N is a home located in King County with nearby schools including Alpac Elementary School, Olympic Middle School, and Auburn Riverside High School.
Ownership History
Date
Name
Owned For
Owner Type
Purchase Details
Closed on
Jul 25, 2017
Sold by
Bramson Ginny and Bramson Steven E
Bought by
Bramson Steven E
Current Estimated Value
Home Financials for this Owner
Home Financials are based on the most recent Mortgage that was taken out on this home.
Original Mortgage
$130,800
Outstanding Balance
$108,995
Interest Rate
3.91%
Mortgage Type
New Conventional
Estimated Equity
$303,333
Purchase Details
Closed on
Dec 9, 2013
Sold by
Bowers Susan May
Bought by
Hill David Edward and Bowers Susan May
Home Financials for this Owner
Home Financials are based on the most recent Mortgage that was taken out on this home.
Original Mortgage
$100,000
Interest Rate
4.04%
Mortgage Type
New Conventional
Purchase Details
Closed on
Jun 24, 1987
Sold by
Ryan Richard R and Ryan Debbie A
Bought by
Bowers Susan May
Create a Home Valuation Report for This Property
The Home Valuation Report is an in-depth analysis detailing your home's value as well as a comparison with similar homes in the area
Home Values in the Area
Average Home Value in this Area
Purchase History
| Date | Buyer | Sale Price | Title Company |
|---|---|---|---|
| Bramson Steven E | -- | First American Title Ins Co | |
| Bramson Steven E | $163,500 | First American Title Ins Co | |
| Hill David Edward | -- | Stewart Title | |
| Bowers Susan May | $50,000 | -- |
Source: Public Records
Mortgage History
| Date | Status | Borrower | Loan Amount |
|---|---|---|---|
| Open | Bramson Steven E | $130,800 | |
| Previous Owner | Hill David Edward | $100,000 |
Source: Public Records
Tax History Compared to Growth
Tax History
| Year | Tax Paid | Tax Assessment Tax Assessment Total Assessment is a certain percentage of the fair market value that is determined by local assessors to be the total taxable value of land and additions on the property. | Land | Improvement |
|---|---|---|---|---|
| 2024 | $3,915 | $340,000 | $135,000 | $205,000 |
| 2023 | $3,557 | $300,000 | $108,000 | $192,000 |
| 2022 | $3,263 | $321,000 | $103,000 | $218,000 |
| 2021 | $3,224 | $254,000 | $88,000 | $166,000 |
| 2020 | $3,089 | $238,000 | $82,000 | $156,000 |
| 2018 | $2,867 | $221,000 | $70,000 | $151,000 |
| 2017 | $2,569 | $188,000 | $59,000 | $129,000 |
| 2016 | $2,192 | $168,000 | $59,000 | $109,000 |
| 2015 | $2,123 | $148,000 | $59,000 | $89,000 |
| 2014 | -- | $138,000 | $55,000 | $83,000 |
| 2013 | -- | $116,000 | $65,000 | $51,000 |
Source: Public Records
Map
Nearby Homes
- 200 10th Ave N
- 311 9th Ave N
- 0 9th Ave N
- 202 11th Ave N
- 732 Algona Blvd N
- 607 Algona Blvd N
- 5624 S 344th Ct
- 34258 56th Ave S
- 515 4th Ave N
- 215 3rd Ave N
- 316 3rd Ave N
- 35542 57th Ave S
- 35420 55th Ave S
- 35250 54th Ave S
- 35421 55th (Lots 17 & 18 ) Ave S
- 412 2nd Ave S
- 35415 51st Ave S
- 438 2nd Ave S
- 5280 S 360th St
- 116 4th Ave S
- 205 9th Ave N
- 902 Algona Blvd N
- 209 9th Ave N
- 3111 9th Ave N
- 0 XXXX 9th Ave N
- 832 Algona Blvd N
- 208 9th Ave N
- 910 Algona Blvd N
- 214 10th Ave N
- 220 9th Ave N
- 212 9th Ave N
- 912 Algona Blvd N
- 912 Algona Blvd N
- 204 10th Ave N
- 216 9th Ave N
- 229 9th Ave N
- 222 10th Ave N
- 210 10th Ave N
- 224 9th Ave N
- 228 9th Ave N