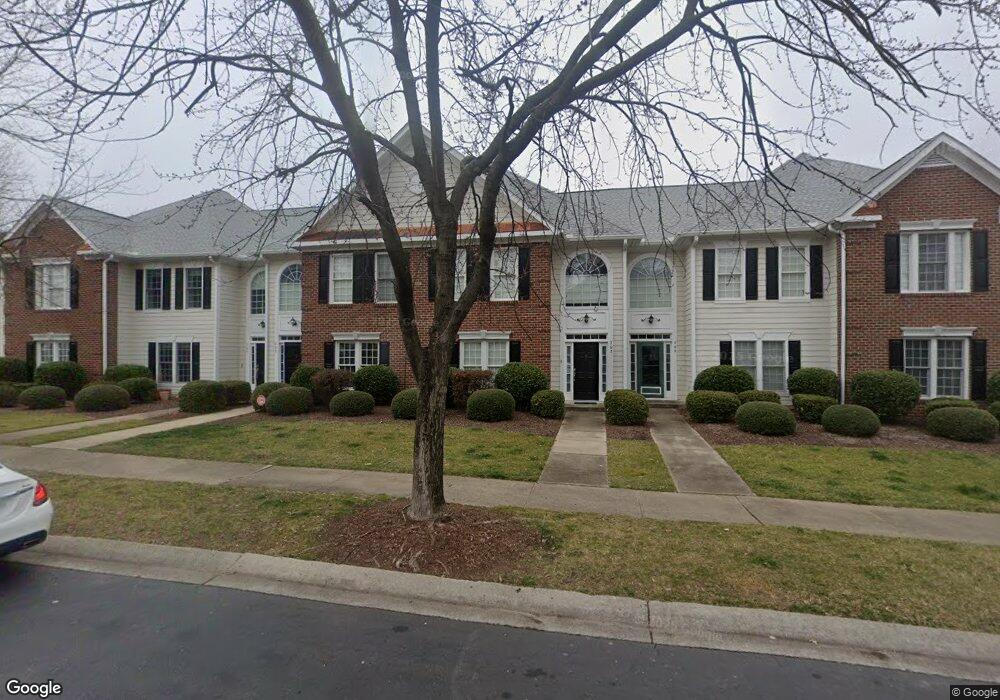
207 Anniston Ct Cary, NC 27519
Carpenter NeighborhoodEstimated Value: $466,000 - $520,000
3
Beds
3
Baths
2,282
Sq Ft
$217/Sq Ft
Est. Value
About This Home
This home is located at 207 Anniston Ct, Cary, NC 27519 and is currently estimated at $494,859, approximately $216 per square foot. 207 Anniston Ct is a home located in Wake County with nearby schools including Carpenter Elementary, Alston Ridge Middle School, and Green Hope High.
Ownership History
Date
Name
Owned For
Owner Type
Purchase Details
Closed on
Feb 13, 2015
Sold by
Winkelmann Craig A
Bought by
Winkelmann Craig A and Craig A Winkelmann Revocable Trust
Current Estimated Value
Purchase Details
Closed on
Nov 16, 2012
Sold by
Ray David A
Bought by
Winkelmann Craig A
Home Financials for this Owner
Home Financials are based on the most recent Mortgage that was taken out on this home.
Original Mortgage
$176,000
Outstanding Balance
$121,677
Interest Rate
3.4%
Mortgage Type
New Conventional
Estimated Equity
$373,182
Purchase Details
Closed on
Jun 27, 2001
Sold by
Impact Design Build Inc
Bought by
Ray David A
Home Financials for this Owner
Home Financials are based on the most recent Mortgage that was taken out on this home.
Original Mortgage
$244,350
Interest Rate
7.14%
Mortgage Type
Stand Alone First
Create a Home Valuation Report for This Property
The Home Valuation Report is an in-depth analysis detailing your home's value as well as a comparison with similar homes in the area
Home Values in the Area
Average Home Value in this Area
Purchase History
| Date | Buyer | Sale Price | Title Company |
|---|---|---|---|
| Winkelmann Craig A | -- | None Available | |
| Winkelmann Craig A | $220,000 | None Available | |
| Ray David A | $244,500 | -- |
Source: Public Records
Mortgage History
| Date | Status | Borrower | Loan Amount |
|---|---|---|---|
| Open | Winkelmann Craig A | $176,000 | |
| Previous Owner | Ray David A | $244,350 | |
| Closed | Ray David A | $36,652 |
Source: Public Records
Tax History Compared to Growth
Tax History
| Year | Tax Paid | Tax Assessment Tax Assessment Total Assessment is a certain percentage of the fair market value that is determined by local assessors to be the total taxable value of land and additions on the property. | Land | Improvement |
|---|---|---|---|---|
| 2025 | $4,232 | $491,374 | $125,000 | $366,374 |
| 2024 | $4,140 | $491,374 | $125,000 | $366,374 |
| 2023 | $3,110 | $308,351 | $69,000 | $239,351 |
| 2022 | $2,994 | $308,351 | $69,000 | $239,351 |
| 2021 | $2,934 | $308,351 | $69,000 | $239,351 |
| 2020 | $2,949 | $308,351 | $69,000 | $239,351 |
| 2019 | $2,590 | $240,060 | $48,000 | $192,060 |
| 2018 | $2,431 | $240,060 | $48,000 | $192,060 |
| 2017 | $2,337 | $240,060 | $48,000 | $192,060 |
| 2016 | $2,302 | $240,060 | $48,000 | $192,060 |
| 2015 | -- | $236,143 | $32,000 | $204,143 |
| 2014 | -- | $236,143 | $32,000 | $204,143 |
Source: Public Records
Map
Nearby Homes
- 104 Ashmore Dr
- 113 Beeley Ct
- 1058 Kingston Grove Dr
- 107 Badin Lake Ct
- 106 Lake Tillery Dr
- 222 Murray Glen Dr
- 200 Madison Grove Place
- 204 Madison Grove Place
- 615 Carpenter Town Ln
- 1400 Gathering Park Cir Unit 202
- 1400 Gathering Park Cir Unit 204
- 1400 Gathering Park Cir Unit 201
- 1600 Gathering Park Cir Unit 303
- 800 Gathering Park Cir Unit 204
- 107 Ackworth Ct
- 1200 Gathering Park Cir Unit 304
- 1200 Gathering Park Cir Unit 302
- 121 Goldenthal Ct
- 308 Madres Ln
- 304 Clementine Dr
- 207 Anniston Ct
- 205 Anniston Ct
- 209 Anniston Ct
- 209 Anniston Ct
- 1200 Morrisville Carpenter Rd
- 1200 Morrisville Carpenter Rd
- 211 Anniston Ct
- 211 Anniston Ct
- 201 Anniston Ct
- 213 Anniston Ct
- 215 Anniston Ct
- 217 Anniston Ct
- 208 Anniston Ct
- 206 Anniston Ct
- 210 Anniston Ct
- 212 Anniston Ct
- 204 Anniston Ct
- 214 Anniston Ct
- 219 Anniston Ct
- 202 Anniston Ct