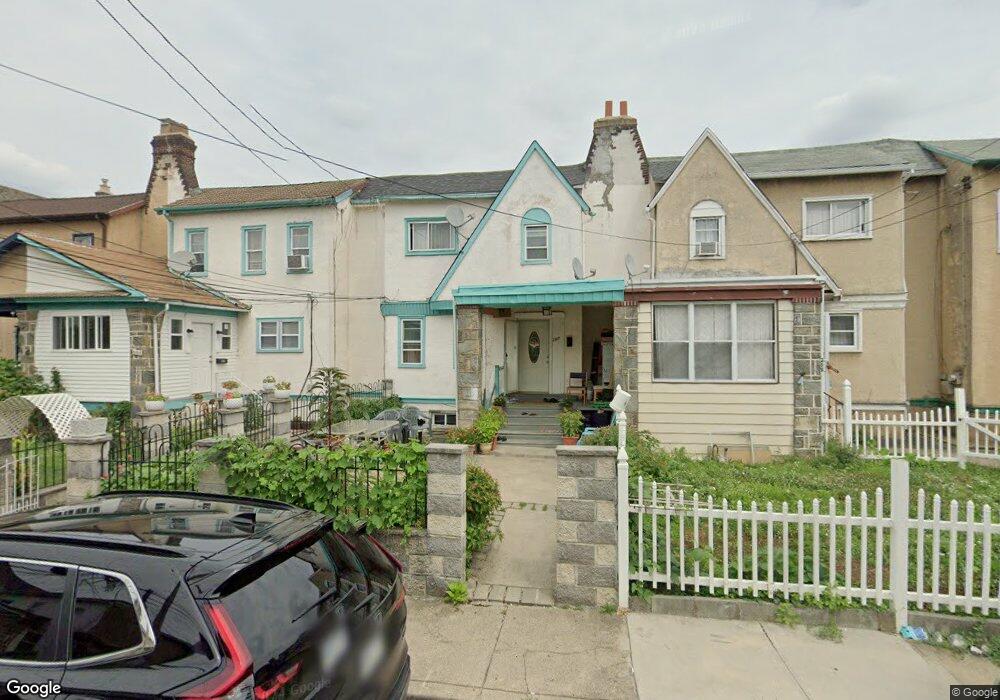
207 Ashby Rd Upper Darby, PA 19082
Estimated Value: $208,524 - $245,000
3
Beds
1
Bath
1,702
Sq Ft
$135/Sq Ft
Est. Value
About This Home
This home is located at 207 Ashby Rd, Upper Darby, PA 19082 and is currently estimated at $230,381, approximately $135 per square foot. 207 Ashby Rd is a home located in Delaware County with nearby schools including Bywood Elementary School, Upper Darby Kdg Center, and Upper Darby High School.
Ownership History
Date
Name
Owned For
Owner Type
Purchase Details
Closed on
Oct 31, 2006
Sold by
Homecomings Financial Network Inc
Bought by
Rouf Forida
Current Estimated Value
Home Financials for this Owner
Home Financials are based on the most recent Mortgage that was taken out on this home.
Original Mortgage
$16,950
Interest Rate
6.4%
Mortgage Type
Unknown
Purchase Details
Closed on
Jul 27, 2006
Sold by
Coleman Sherman L and Berthau Coleman Sylvia
Bought by
Homecomings Financial Network Inc
Purchase Details
Closed on
Dec 16, 1997
Sold by
Tavella Robert D and Tavella Carol
Bought by
Coleman Sherman L and Coleman Sylvia Berthau
Home Financials for this Owner
Home Financials are based on the most recent Mortgage that was taken out on this home.
Original Mortgage
$44,925
Interest Rate
6.64%
Mortgage Type
Balloon
Create a Home Valuation Report for This Property
The Home Valuation Report is an in-depth analysis detailing your home's value as well as a comparison with similar homes in the area
Home Values in the Area
Average Home Value in this Area
Purchase History
| Date | Buyer | Sale Price | Title Company |
|---|---|---|---|
| Rouf Forida | $113,000 | First Option Title Agency Ll | |
| Homecomings Financial Network Inc | $1,000 | None Available | |
| Coleman Sherman L | $59,900 | Commonwealth Land Title Ins |
Source: Public Records
Mortgage History
| Date | Status | Borrower | Loan Amount |
|---|---|---|---|
| Closed | Rouf Forida | $16,950 | |
| Open | Rouf Forida | $90,400 | |
| Previous Owner | Coleman Sherman L | $44,925 | |
| Closed | Coleman Sherman L | $3,895 |
Source: Public Records
Tax History Compared to Growth
Tax History
| Year | Tax Paid | Tax Assessment Tax Assessment Total Assessment is a certain percentage of the fair market value that is determined by local assessors to be the total taxable value of land and additions on the property. | Land | Improvement |
|---|---|---|---|---|
| 2025 | $3,942 | $93,220 | $24,020 | $69,200 |
| 2024 | $3,942 | $93,220 | $24,020 | $69,200 |
| 2023 | $3,905 | $93,220 | $24,020 | $69,200 |
| 2022 | $3,800 | $93,220 | $24,020 | $69,200 |
| 2021 | $5,124 | $93,220 | $24,020 | $69,200 |
| 2020 | $3,804 | $58,810 | $18,690 | $40,120 |
| 2019 | $3,737 | $58,810 | $18,690 | $40,120 |
| 2018 | $3,694 | $58,810 | $0 | $0 |
| 2017 | $3,598 | $58,810 | $0 | $0 |
| 2016 | $323 | $58,810 | $0 | $0 |
| 2015 | $329 | $58,810 | $0 | $0 |
| 2014 | $323 | $58,810 | $0 | $0 |
Source: Public Records
Map
Nearby Homes