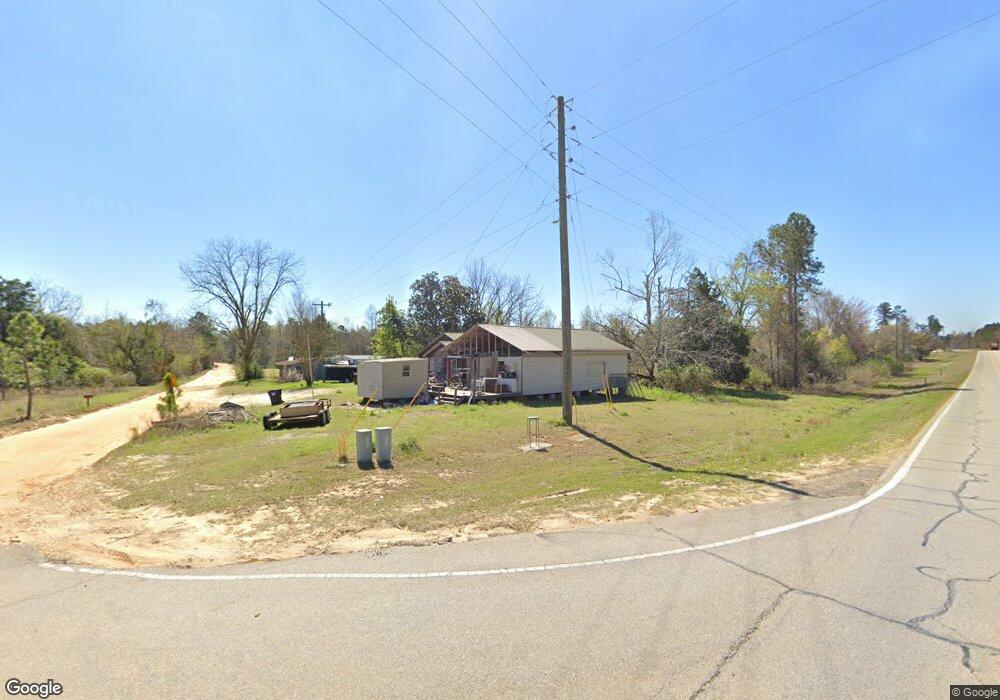
207 Blun Rd Swainsboro, GA 30401
Estimated Value: $118,000 - $228,000
3
Beds
2
Baths
1,680
Sq Ft
$103/Sq Ft
Est. Value
About This Home
This home is located at 207 Blun Rd, Swainsboro, GA 30401 and is currently estimated at $172,409, approximately $102 per square foot. 207 Blun Rd is a home located in Emanuel County with nearby schools including Swainsboro Primary School, Swainsboro Elementary School, and Swainsboro Middle School.
Ownership History
Date
Name
Owned For
Owner Type
Purchase Details
Closed on
Dec 29, 2017
Sold by
Hartmeyer Derek
Bought by
Sause Thomas E and Sause Stacie A
Current Estimated Value
Home Financials for this Owner
Home Financials are based on the most recent Mortgage that was taken out on this home.
Original Mortgage
$75,000
Outstanding Balance
$51,185
Interest Rate
3.9%
Mortgage Type
New Conventional
Estimated Equity
$121,224
Purchase Details
Closed on
Jun 28, 2013
Sold by
Sec Of Housing & U
Bought by
Hartmeyer Justin
Home Financials for this Owner
Home Financials are based on the most recent Mortgage that was taken out on this home.
Original Mortgage
$24,464
Interest Rate
3.79%
Mortgage Type
New Conventional
Purchase Details
Closed on
Jul 3, 2012
Sold by
Jpmorgan Chase Bank
Bought by
Sec Of Housing & Urban
Purchase Details
Closed on
Oct 26, 2009
Sold by
Davis Tommy
Bought by
Hartmeyer Charles Derek
Create a Home Valuation Report for This Property
The Home Valuation Report is an in-depth analysis detailing your home's value as well as a comparison with similar homes in the area
Home Values in the Area
Average Home Value in this Area
Purchase History
| Date | Buyer | Sale Price | Title Company |
|---|---|---|---|
| Sause Thomas E | $75,000 | -- | |
| Hartmeyer Derek | $24,000 | -- | |
| Hartmeyer Justin | $24,450 | -- | |
| Sec Of Housing & Urban | $25,600 | -- | |
| Jpmorgan Chase Bank | $25,600 | -- | |
| Hartmeyer Charles Derek | $5,000 | -- |
Source: Public Records
Mortgage History
| Date | Status | Borrower | Loan Amount |
|---|---|---|---|
| Open | Hartmeyer Derek | $75,000 | |
| Closed | Sause Thomas E | $75,000 | |
| Previous Owner | Hartmeyer Justin | $24,464 |
Source: Public Records
Tax History Compared to Growth
Tax History
| Year | Tax Paid | Tax Assessment Tax Assessment Total Assessment is a certain percentage of the fair market value that is determined by local assessors to be the total taxable value of land and additions on the property. | Land | Improvement |
|---|---|---|---|---|
| 2024 | $1,168 | $40,410 | $5,371 | $35,039 |
| 2023 | $979 | $33,697 | $4,220 | $29,477 |
| 2022 | $864 | $30,773 | $4,220 | $26,553 |
| 2021 | $819 | $28,553 | $3,836 | $24,717 |
| 2020 | $513 | $16,546 | $2,759 | $13,787 |
| 2019 | $752 | $24,884 | $2,759 | $22,125 |
| 2018 | $348 | $12,110 | $2,759 | $9,351 |
| 2017 | $349 | $12,110 | $2,759 | $9,351 |
| 2016 | $347 | $12,050 | $2,705 | $9,345 |
| 2015 | -- | $12,050 | $2,705 | $9,345 |
| 2014 | -- | $28,637 | $4,598 | $24,039 |
| 2013 | -- | $33,322 | $4,590 | $28,732 |
Source: Public Records
Map
Nearby Homes
- 00 Georgia 56
- 1 Hawhammock Church Rd
- 120 Saint Galilee Rd
- 0 Old Wadley Rd Unit TRACT 9
- 0 Old Wadley Rd Unit TRACT 7
- 0 Old Wadley Rd Unit TRACT 10
- 0 Bishop Chapel Church Rd Unit 25437386
- 0 Bishop Chapel Church Rd Unit 11601117
- Brantley Loop
- 122 Ehrlich Farm Rd
- 1073 Hawhammock Ch Rd
- 150 Blackberry Trail
- 143 Atkinson Dr
- 1016 Old Wadley Rd
- 310 Advantage Ln
- 178 Advantage Ln
- 0 Modoc Rd Unit 10587358
- 0 Modoc Rd Unit 25131986
- 211 Wells St
- 625 Allen St Unit 12
- 207 Blun Rd
- 197 Blun Rd
- 193 Blun Rd
- 2145 Ga Highway 56 N
- 1492 Ga Highway 56 N
- 168 Underwood Loop
- 1416 Ga Highway 56 N
- 1416 Ga Highway 56 N
- 159 Underwood Loop
- 137 Underwood Loop
- 165 Underwood Loop
- 1516 Ga Highway 56 N
- 238 Underwood Loop
- 123 Underwood Loop
- 1542 Ga Highway 56 N
- 235 Underwood Loop
- 1538 Ga Highway 56 N
- 1560 Ga Highway 56 N
- 0 Joe Bynes Rd
- 0 Joe Bynes Rd Unit 8068723