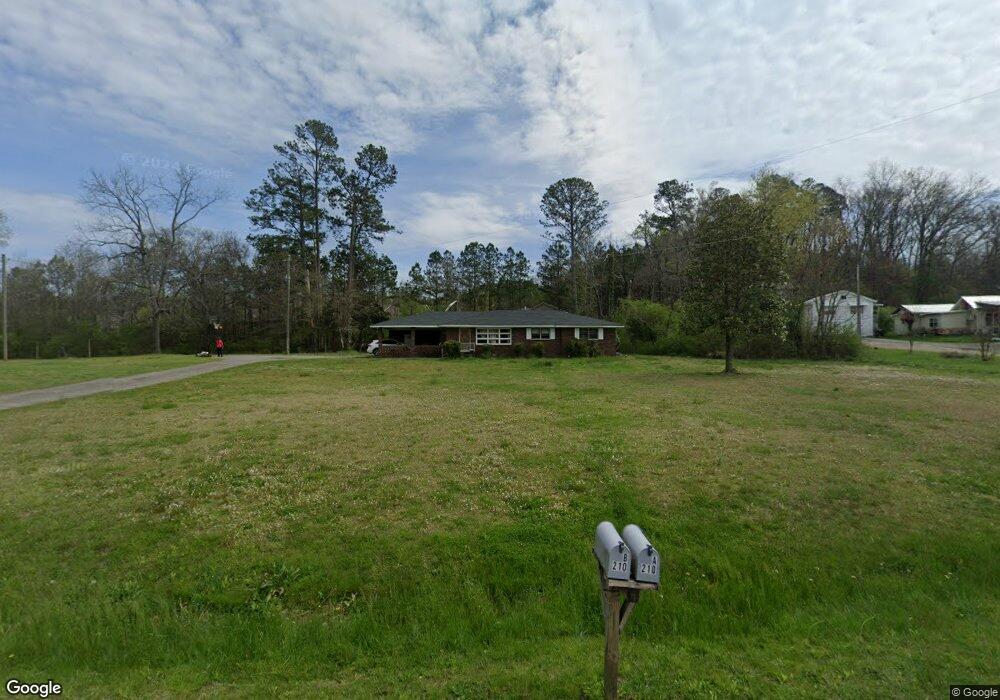
207 Cason Rd Cedartown, GA 30125
Estimated Value: $183,000 - $203,476
3
Beds
2
Baths
1,479
Sq Ft
$130/Sq Ft
Est. Value
About This Home
This home is located at 207 Cason Rd, Cedartown, GA 30125 and is currently estimated at $192,369, approximately $130 per square foot. 207 Cason Rd is a home located in Polk County with nearby schools including Cedar Christian School.
Ownership History
Date
Name
Owned For
Owner Type
Purchase Details
Closed on
Sep 11, 2020
Sold by
Hunt R Scott
Bought by
Cook Jacob Shelby and Cook Megan Elizabeth
Current Estimated Value
Home Financials for this Owner
Home Financials are based on the most recent Mortgage that was taken out on this home.
Original Mortgage
$57,120
Outstanding Balance
$50,690
Interest Rate
2.9%
Mortgage Type
New Conventional
Estimated Equity
$141,679
Purchase Details
Closed on
Oct 4, 2013
Sold by
Garrett Jean H
Bought by
Bryon Hunt P and Bryon **Co-Trustees R
Purchase Details
Closed on
Dec 21, 2012
Sold by
Garrett Jean H
Bought by
Hunt P Scott R and Marion Jean H Garrett C
Purchase Details
Closed on
Jan 22, 1983
Sold by
Hunt Ronnie
Bought by
Hunt Jean R Mrs
Purchase Details
Closed on
Oct 6, 1961
Sold by
Hunt Mrs Betty S**Executrix Of The Last
Bought by
Hunt Ronald B
Create a Home Valuation Report for This Property
The Home Valuation Report is an in-depth analysis detailing your home's value as well as a comparison with similar homes in the area
Home Values in the Area
Average Home Value in this Area
Purchase History
| Date | Buyer | Sale Price | Title Company |
|---|---|---|---|
| Cook Jacob Shelby | $71,400 | -- | |
| Bryon Hunt P | -- | -- | |
| Hunt P Scott R | -- | -- | |
| Hunt Jean R Mrs | -- | -- | |
| Hunt Ronald B | -- | -- |
Source: Public Records
Mortgage History
| Date | Status | Borrower | Loan Amount |
|---|---|---|---|
| Open | Cook Jacob Shelby | $57,120 |
Source: Public Records
Tax History Compared to Growth
Tax History
| Year | Tax Paid | Tax Assessment Tax Assessment Total Assessment is a certain percentage of the fair market value that is determined by local assessors to be the total taxable value of land and additions on the property. | Land | Improvement |
|---|---|---|---|---|
| 2024 | $1,903 | $60,238 | $4,800 | $55,438 |
| 2023 | $1,275 | $36,782 | $1,892 | $34,890 |
| 2022 | $751 | $31,656 | $1,892 | $29,764 |
| 2021 | $687 | $31,656 | $1,892 | $29,764 |
| 2020 | $495 | $20,560 | $1,892 | $18,668 |
| 2019 | $639 | $23,786 | $2,270 | $21,516 |
| 2018 | $628 | $22,780 | $1,946 | $20,834 |
| 2017 | $620 | $22,780 | $1,946 | $20,834 |
| 2016 | $620 | $22,780 | $1,946 | $20,834 |
| 2015 | $560 | $20,507 | $1,946 | $18,561 |
| 2014 | $564 | $20,507 | $1,946 | $18,561 |
Source: Public Records
Map
Nearby Homes
- 203 Cason Rd
- 117 Cason Rd
- 205 Pinecrest Rd
- 149 Irwin St
- 480 Cason Rd
- 0 Philpot Springs Unit 10626665
- 129 W Ellawood Ave
- 151 W Ellawood Ave
- 325 Fairview Ave
- 234 Brooks St
- 1003 Fairview Ave
- 35 Old Mill Rd
- 634 Georgia Ave
- 634 Georgia Ave Unit 123
- 729 S College St
- 129 Thompson St
- 226 Central St
- 2460 Hidden Creek Rd
- 00 Juliette St
- 1987 Buchanan Hwy