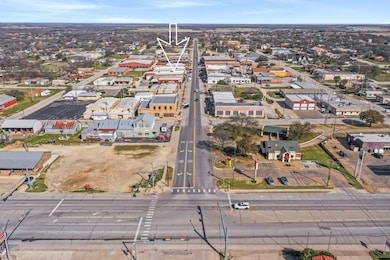
207 Clay St Nocona, TX 76255
Estimated payment $1,681/month
About This Lot
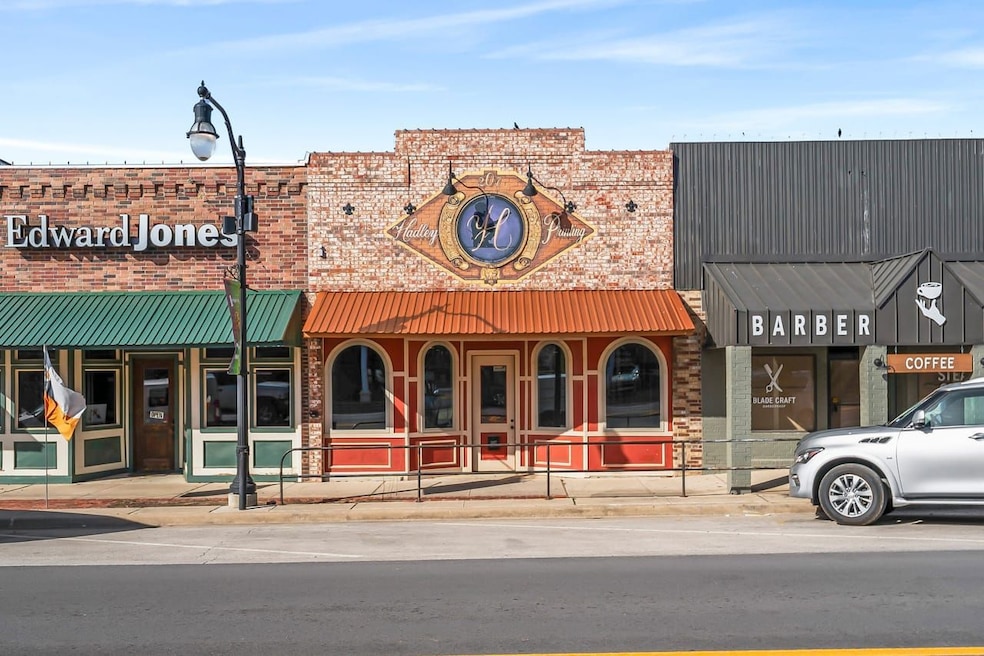
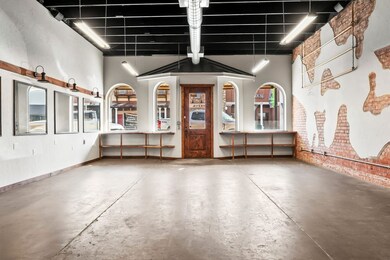
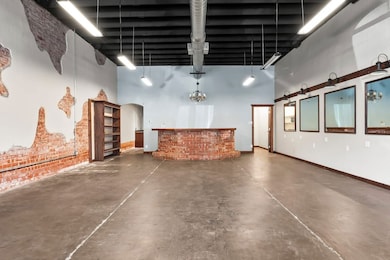
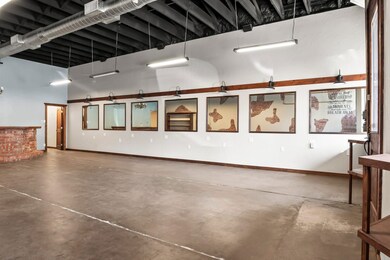
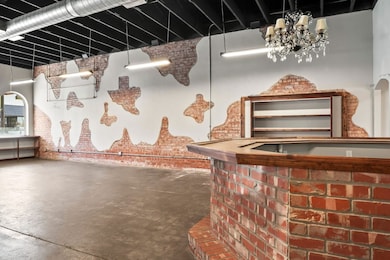
This historic building, located in the heart of charming Nocona, sits along the revitalized Clay Street, where numerous buildings have been beautifully restored, and exciting new businesses have opened their doors. About 13 years ago, this property underwent a comprehensive renovation, including updates to the electrical system, heating and air conditioning, and all the finishing touches, making it an ideal space for either a business or a residencewhichever suits your needs.
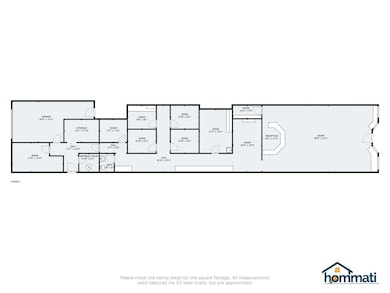
The front of the building has been thoughtfully remodeled, creating a striking first impression for anyone driving down the street. In addition to its street-front appeal, the property offers convenient alley access with a garage door for easy vehicle entry and ample storage space, providing practical solutions for your needs.
If you're looking for your very own piece of Nocona, one of Texas' friendliest towns, this property is the perfect opportunity.

Property Details
Property Type
- Land
Est. Annual Taxes
- $4,371
Bedrooms and Bathrooms
- 0.5 Bathroom
Map
Home Values in the Area
Average Home Value in this Area
Tax History
| Year | Tax Paid | Tax Assessment Tax Assessment Total Assessment is a certain percentage of the fair market value that is determined by local assessors to be the total taxable value of land and additions on the property. | Land | Improvement |
|---|---|---|---|---|
| 2024 | $4,371 | $215,400 | $11,250 | $204,150 |
| 2023 | $3,700 | $207,960 | $11,250 | $196,710 |
| 2022 | $3,950 | $207,960 | $11,250 | $196,710 |
| 2021 | $4,492 | $204,210 | $7,500 | $196,710 |
| 2020 | $3,882 | $176,610 | $7,500 | $169,110 |
| 2019 | $4,064 | $176,610 | $7,500 | $169,110 |
| 2018 | $4,010 | $173,490 | $7,500 | $165,990 |
| 2017 | $3,909 | $173,490 | $7,500 | $165,990 |
| 2016 | $3,909 | $173,490 | $7,500 | $165,990 |
| 2015 | -- | $173,490 | $7,500 | $165,990 |
| 2014 | -- | $173,490 | $7,500 | $165,990 |
Property History
| Date | Event | Price | List to Sale | Price per Sq Ft |
|---|---|---|---|---|
| 03/14/2025 03/14/25 | For Sale | $249,900 | -- | $81 / Sq Ft |
Purchase History
| Date | Type | Sale Price | Title Company |
|---|---|---|---|
| Warranty Deed | $34,900 | None Available | |
| Vendors Lien | -- | None Available |
Mortgage History
| Date | Status | Loan Amount | Loan Type |
|---|---|---|---|
| Previous Owner | $180,000 | Purchase Money Mortgage |
- 316 Clay St
- 355 Trailride Ln
- 354 Trailride Ln
- 308 Cooke St
- 207 W Walnut St
- 0 U S Highway 82 Unit 20878111
- TBD U S Highway 82
- 109 Sherman St
- 411 W Pine St
- 607 Baylor St
- 204 Dallas St
- Lot 197 Cedar St
- Lot 198 Cedar St
- TBD 104 Acres Farm To Market Road 103
- 17273 Farm To Market Road 103
- 205 Bonham St
- 1762 U S Highway 82
- 251 Pondview Ln
- 610 W Oak St
- 407 W Pecan St
- 348 Lake Loop
- 222 County Road 357
- 1005 Roberts St
- 701 Hulme St
- 708 Cooper St
- 610 N Mason St
- 507 Hodge St
- 600 N Mill St
- 419 Miller St
- 802 Old Wise Rd Unit 23
- 802 Old Wise Rd Unit 22
- 802 Old Wise Rd Unit 21
- 802 Old Wise Rd Unit 20
- 1201 E Wise St
- 1201 E Wise St Unit Studio
- 404 W Wichita St
- 1402 Posey Brewer Rd
- 911 Proctor Ln
- 151 County Road 369