Estimated Value: $567,251 - $621,000
3
Beds
3
Baths
2,166
Sq Ft
$276/Sq Ft
Est. Value
About This Home
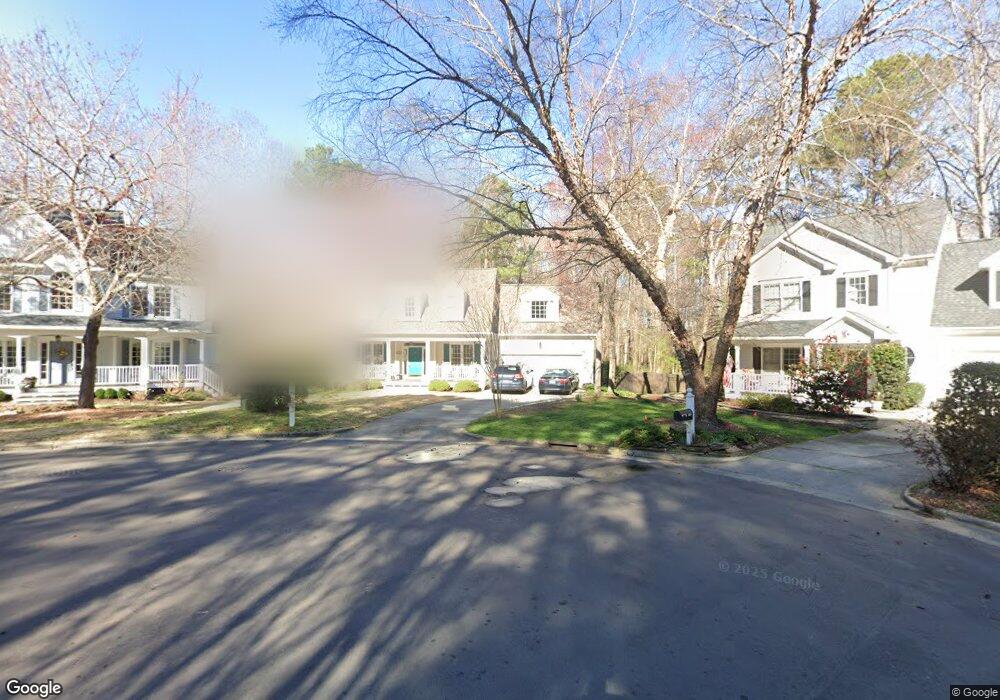
This home is located at 207 Curley Maple Ct, Apex, NC 27502 and is currently estimated at $598,063, approximately $276 per square foot. 207 Curley Maple Ct is a home located in Wake County with nearby schools including Scotts Ridge Elementary School, Apex Middle, and Apex High School.
Ownership History
Date
Name
Owned For
Owner Type
Purchase Details
Closed on
Dec 30, 2002
Sold by
Brookhart Megan Mccarty and Brookhart Scott W
Bought by
Freedman Daniel S and Freedman Amanda B
Current Estimated Value
Home Financials for this Owner
Home Financials are based on the most recent Mortgage that was taken out on this home.
Original Mortgage
$187,600
Interest Rate
5.95%
Purchase Details
Closed on
Jun 3, 1999
Sold by
Vintage Homes Inc
Bought by
Brookhart Scott W and Brookhart Megan Mccarty
Home Financials for this Owner
Home Financials are based on the most recent Mortgage that was taken out on this home.
Original Mortgage
$188,000
Interest Rate
6.62%
Create a Home Valuation Report for This Property
The Home Valuation Report is an in-depth analysis detailing your home's value as well as a comparison with similar homes in the area
Purchase History
| Date | Buyer | Sale Price | Title Company |
|---|---|---|---|
| Freedman Daniel S | $234,500 | -- | |
| Brookhart Scott W | $213,500 | -- |
Source: Public Records
Mortgage History
| Date | Status | Borrower | Loan Amount |
|---|---|---|---|
| Previous Owner | Freedman Daniel S | $187,600 | |
| Previous Owner | Brookhart Scott W | $188,000 | |
| Closed | Freedman Daniel S | $17,500 |
Source: Public Records
Tax History
| Year | Tax Paid | Tax Assessment Tax Assessment Total Assessment is a certain percentage of the fair market value that is determined by local assessors to be the total taxable value of land and additions on the property. | Land | Improvement |
|---|---|---|---|---|
| 2025 | $4,964 | $566,227 | $189,000 | $377,227 |
| 2024 | $4,853 | $566,227 | $189,000 | $377,227 |
Source: Public Records
Map
Nearby Homes
- 113 Country Valley Ct
- 1303 Goldspot Ct
- 106 Forestcrest Ct
- 1314 Chenworth Dr
- 1216 Scotts Ridge Trail
- 400 Village Loop Dr
- 402 Village Loop Dr
- 1305 Olde Walker Mill Rd
- 1701 Melbry Ct
- 1702 Melbry Ct
- 1701 Grand Barton Ct
- 440 Oak Pine Dr
- 1002 Tribble Gate Ct
- 3021 White Cloud Cir
- 2997 Green Tractor Ave
- 2117 Barrier Ridge Way
- 2113 Barrier Ridge Way
- 2115 Barrier Ridge Way
- 2119 Barrier Ridge Way
- 1105 Capitata Crossing
- 209 Curley Maple Ct
- 205 Curley Maple Ct
- 112 Hawkscrest Ct
- 203 Curley Maple Ct
- 208 Curley Maple Ct
- 206 Curley Maple Ct
- 202 Curley Maple Ct
- 106 Hawkscrest Ct
- 300 Hickory Bottom Ct
- 304 Hickory Bottom Ct
- 200 Curley Maple Ct
- 109 Hawkscrest Ct
- 100 Hawkscrest Ct
- 108 Curley Maple Ct
- 105 Hawkscrest Ct
- 112 Cedar Wynd Dr
- 1512 Patterson Grove Rd
- 1510 Patterson Grove Rd
- 2734 Curley Maple Ct
- 2730 Curley Maple Ct
Your Personal Tour Guide
Ask me questions while you tour the home.