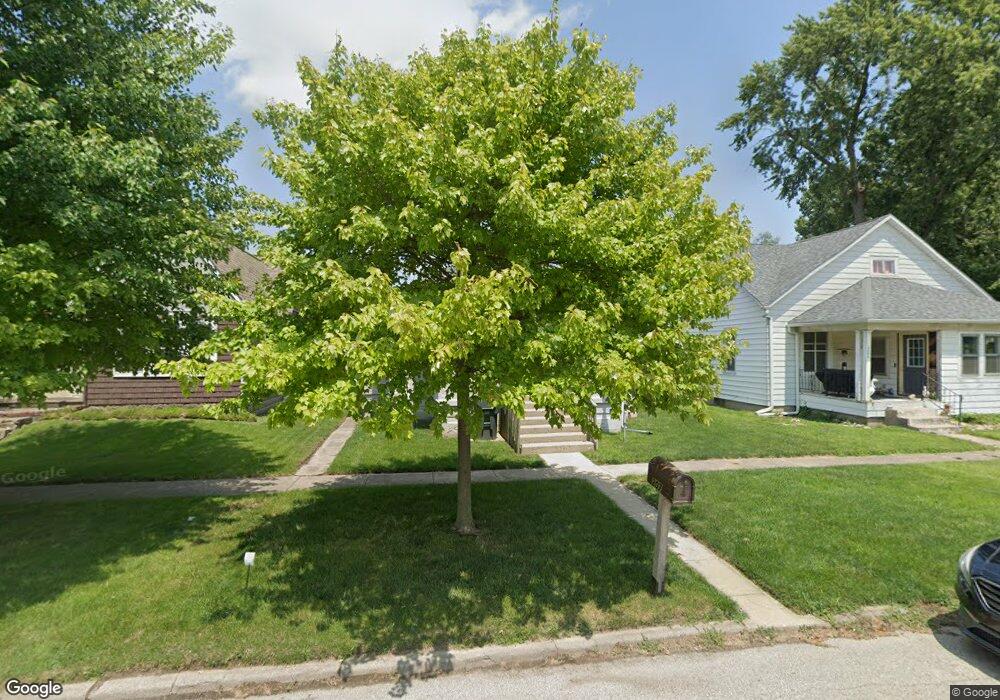
207 E 3rd St Fowler, IN 47944
Estimated Value: $80,000 - $135,229
2
Beds
1
Bath
899
Sq Ft
$130/Sq Ft
Est. Value
About This Home
This home is located at 207 E 3rd St, Fowler, IN 47944 and is currently estimated at $116,807, approximately $129 per square foot. 207 E 3rd St is a home located in Benton County with nearby schools including Benton Central Junior/Senior High School and Sacred Heart Elementary School.
Ownership History
Date
Name
Owned For
Owner Type
Purchase Details
Closed on
Mar 5, 2021
Sold by
Gick Christine L
Bought by
Benner Jeremy and Mermoud Lisa M
Current Estimated Value
Home Financials for this Owner
Home Financials are based on the most recent Mortgage that was taken out on this home.
Original Mortgage
$48,484
Outstanding Balance
$42,966
Interest Rate
2.7%
Mortgage Type
Stand Alone Refi Refinance Of Original Loan
Estimated Equity
$73,841
Purchase Details
Closed on
Feb 7, 1996
Sold by
Not Provided
Bought by
Not Provided
Create a Home Valuation Report for This Property
The Home Valuation Report is an in-depth analysis detailing your home's value as well as a comparison with similar homes in the area
Purchase History
| Date | Buyer | Sale Price | Title Company |
|---|---|---|---|
| Benner Jeremy | -- | None Available | |
| Not Provided | $14,880 | -- |
Source: Public Records
Mortgage History
| Date | Status | Borrower | Loan Amount |
|---|---|---|---|
| Open | Benner Jeremy | $48,484 |
Source: Public Records
Tax History
| Year | Tax Paid | Tax Assessment Tax Assessment Total Assessment is a certain percentage of the fair market value that is determined by local assessors to be the total taxable value of land and additions on the property. | Land | Improvement |
|---|---|---|---|---|
| 2025 | $1,021 | $100,600 | $7,300 | $93,300 |
| 2024 | $1,021 | $108,700 | $7,300 | $101,400 |
| 2023 | $823 | $95,400 | $6,400 | $89,000 |
| 2022 | $540 | $76,700 | $6,400 | $70,300 |
| 2021 | $365 | $41,800 | $6,400 | $35,400 |
| 2020 | $941 | $43,700 | $6,400 | $37,300 |
| 2019 | $907 | $45,300 | $6,400 | $38,900 |
| 2018 | $936 | $46,800 | $6,400 | $40,400 |
| 2017 | $874 | $43,700 | $6,400 | $37,300 |
| 2016 | $820 | $41,000 | $6,400 | $34,600 |
| 2014 | $704 | $35,200 | $5,700 | $29,500 |
| 2013 | $704 | $35,400 | $5,400 | $30,000 |
Source: Public Records
Map
Nearby Homes
- 307 N Madison Ave
- 202 N Van Buren Ave
- 303 N Jackson Ave
- 307 N Washington Ave
- 601 E 3rd St
- 111 W 4th St
- 305 N Lincoln Ave
- 502 E 5th St
- 705 N Adams Ave
- 206 E Maple St
- 703 W 2nd St
- Lot 9 W 2nd St
- 665 W 2nd St
- Lot 12 W 2nd St
- Lot 10 W 2nd St
- 653 W 2nd St
- 501 E 7th St
- 310 E 7th St
- 503 E 8th St
- 511 W Main St
Your Personal Tour Guide
Ask me questions while you tour the home.