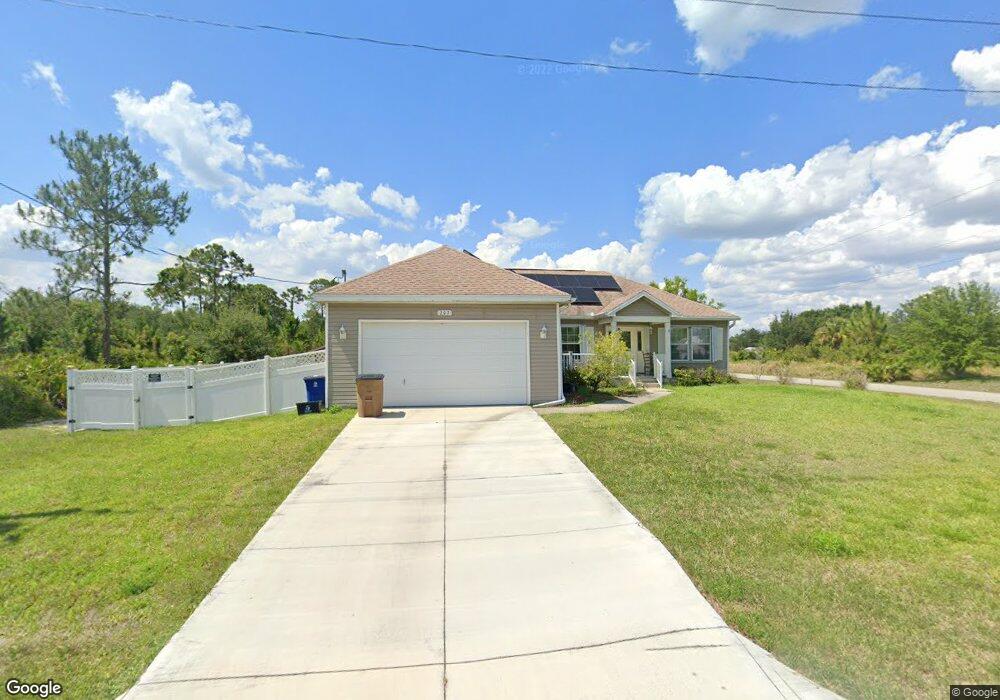
207 E 9th St Unit 6 Lehigh Acres, FL 33972
Richmond NeighborhoodEstimated Value: $281,549 - $363,000
3
Beds
2
Baths
1,585
Sq Ft
$204/Sq Ft
Est. Value
About This Home
This home is located at 207 E 9th St Unit 6, Lehigh Acres, FL 33972 and is currently estimated at $322,637, approximately $203 per square foot. 207 E 9th St Unit 6 is a home located in Lee County with nearby schools including Lehigh Elementary School, The Alva School, and Gateway Elementary School.
Ownership History
Date
Name
Owned For
Owner Type
Purchase Details
Closed on
Jun 21, 2024
Sold by
Spasaro Winifred
Bought by
Spasaro Winifred M
Current Estimated Value
Purchase Details
Closed on
Jul 13, 2023
Sold by
Spasaro Winifred Le
Bought by
Spasaro Winifred
Purchase Details
Closed on
Jan 21, 2010
Sold by
Morequity Inc
Bought by
Spasaro Winifred
Purchase Details
Closed on
Nov 3, 2009
Sold by
Ronan James and Ronan Jennifer
Bought by
Morequity Inc
Purchase Details
Closed on
May 5, 2004
Sold by
Westpoints Development Llc
Bought by
Ronan James and Ronan Jennifer
Home Financials for this Owner
Home Financials are based on the most recent Mortgage that was taken out on this home.
Original Mortgage
$118,140
Interest Rate
5.88%
Mortgage Type
Unknown
Purchase Details
Closed on
Jan 15, 2004
Sold by
Opper Rick
Bought by
Opper William
Create a Home Valuation Report for This Property
The Home Valuation Report is an in-depth analysis detailing your home's value as well as a comparison with similar homes in the area
Home Values in the Area
Average Home Value in this Area
Purchase History
| Date | Buyer | Sale Price | Title Company |
|---|---|---|---|
| Spasaro Winifred M | $100 | None Listed On Document | |
| Spasaro Winifred | $100 | None Listed On Document | |
| Spasaro Winifred | $53,400 | Liberty Title & Escrow Co | |
| Morequity Inc | $40,000 | Attorney | |
| Ronan James | $147,700 | Classic Title Services Inc | |
| Opper William | $3,000 | -- |
Source: Public Records
Mortgage History
| Date | Status | Borrower | Loan Amount |
|---|---|---|---|
| Previous Owner | Ronan James | $118,140 |
Source: Public Records
Tax History
| Year | Tax Paid | Tax Assessment Tax Assessment Total Assessment is a certain percentage of the fair market value that is determined by local assessors to be the total taxable value of land and additions on the property. | Land | Improvement |
|---|---|---|---|---|
| 2025 | $1,778 | $237,808 | $12,113 | $215,909 |
| 2024 | $1,632 | $120,301 | -- | -- |
Source: Public Records
Map
Nearby Homes
- 203 E 9th St
- 902 Clayton Ave
- 906 Clayton Ave
- 818 Calvin Ave
- 909 Richmond Ave N
- 904 Richmond Ave N
- 810 Clayton Ave
- 811 Richmond Ave N
- 914 Richmond Ave N
- 919 Calvin Ave
- 916 Richmond Ave N
- 804 Calvin Ave
- 206 E 10th St
- 204 E 10th St
- 505 E 9th St
- 922 Richmond Ave N
- 201 8th St E
- 17 W 9th St
- 904 Poinsettia Ave
- 602 E 9th St
- 903 Calvin Ave
- 301 E 9th St
- 301 E 9th St
- 902 Calvin Ave
- 340 E 9th St
- 820 Calvin Ave
- 305 E 9th St
- 906 Calvin Ave
- 304 E 9th St
- 906 Clayton Ave
- 906 Clayton Ave
- 903 Richmond Ave N
- 307 E 9th St
- 817 Calvin Ave
- 106 E 9th St
- 306 E 9th St Unit 1
- 821 Richmond Ave N
- 907 Richmond Ave N
- 816 Clayton Ave Unit 4
- 819 Richmond Ave N
Your Personal Tour Guide
Ask me questions while you tour the home.