Estimated Value: $116,000 - $212,000
3
Beds
2
Baths
1,245
Sq Ft
$127/Sq Ft
Est. Value
About This Home
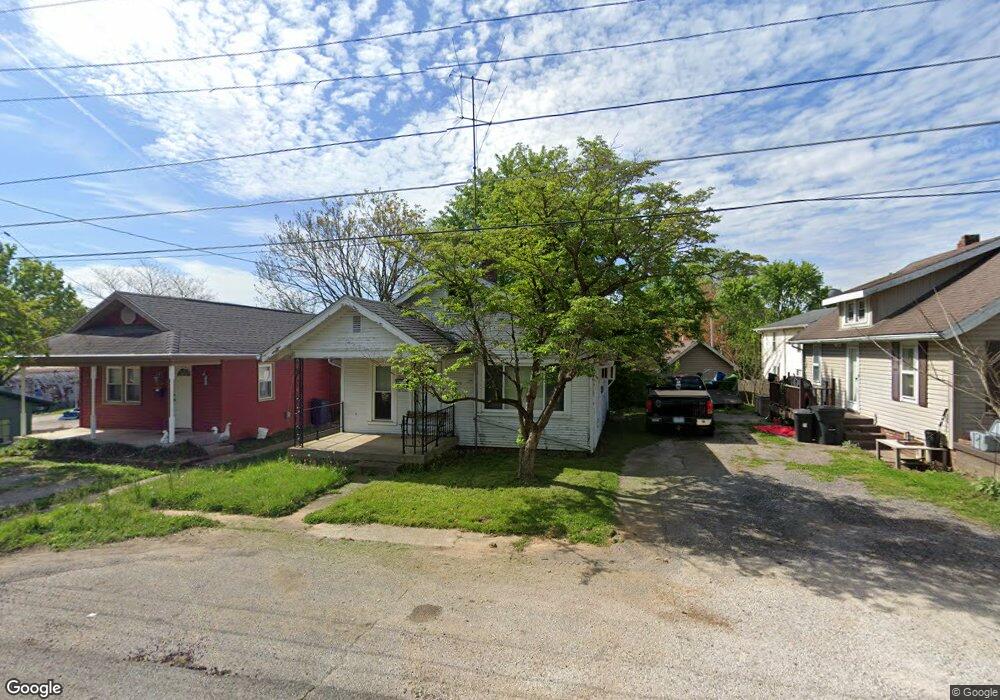
This home is located at 207 E Cherry St, Salem, IN 47167 and is currently estimated at $157,920, approximately $126 per square foot. 207 E Cherry St is a home located in Washington County with nearby schools including Bradie M. Shrum Lower Elementary School, Salem Middle School, and Salem High School.
Ownership History
Date
Name
Owned For
Owner Type
Purchase Details
Closed on
Aug 18, 2021
Sold by
Albertson Tammy J
Bought by
Campbell Rebecca K
Current Estimated Value
Home Financials for this Owner
Home Financials are based on the most recent Mortgage that was taken out on this home.
Original Mortgage
$83,838
Outstanding Balance
$75,407
Interest Rate
2.9%
Mortgage Type
New Conventional
Estimated Equity
$82,513
Purchase Details
Closed on
Aug 16, 2019
Sold by
Zimmer Deb
Bought by
Albertson Tammy J
Create a Home Valuation Report for This Property
The Home Valuation Report is an in-depth analysis detailing your home's value as well as a comparison with similar homes in the area
Home Values in the Area
Average Home Value in this Area
Purchase History
| Date | Buyer | Sale Price | Title Company |
|---|---|---|---|
| Campbell Rebecca K | $83,000 | Signature Title Llc | |
| Albertson Tammy J | -- | None Available |
Source: Public Records
Mortgage History
| Date | Status | Borrower | Loan Amount |
|---|---|---|---|
| Open | Campbell Rebecca K | $83,838 |
Source: Public Records
Tax History
| Year | Tax Paid | Tax Assessment Tax Assessment Total Assessment is a certain percentage of the fair market value that is determined by local assessors to be the total taxable value of land and additions on the property. | Land | Improvement |
|---|---|---|---|---|
| 2025 | $850 | $98,500 | $6,000 | $92,500 |
| 2024 | $850 | $85,000 | $6,000 | $79,000 |
| 2023 | $745 | $76,800 | $6,000 | $70,800 |
| 2022 | $674 | $67,400 | $6,000 | $61,400 |
| 2021 | $616 | $61,600 | $6,000 | $55,600 |
| 2020 | $582 | $58,200 | $6,000 | $52,200 |
| 2019 | $557 | $55,700 | $6,000 | $49,700 |
| 2018 | $402 | $50,800 | $6,000 | $44,800 |
| 2017 | $420 | $61,800 | $6,000 | $55,800 |
| 2016 | $321 | $56,800 | $6,000 | $50,800 |
| 2014 | $1,147 | $57,300 | $6,000 | $51,300 |
| 2013 | $1,115 | $55,700 | $6,000 | $49,700 |
Source: Public Records
Map
Nearby Homes
- 301 E Market St
- 208 Highland Dr
- 412 Ridgeview Dr
- 409 N Water St
- 509 N High St
- 701 S Main St
- 115 Nichols Ave
- 604 N Main St
- 803 W Market St
- 104 Hounds Way
- 101, 103, & 105 Hounds Way
- 901 N College Ave
- 11 Campbell Ct
- 905 Locust St
- 115 Lincoln St
- 107 Walker Blvd
- 114 Lincoln St
- 201 Marshall Ave
- 607 Berkey St
- 218 Washington Blvd
- 207 E Cherry St
- 209 E Cherry St
- 304 1/2 S High St
- 304 S High St
- 203 E Cherry St
- 302 S College Ave
- 206 E Cherry St
- 204 E Cherry St
- 302 S High St
- 300 S High St
- 205 S College Ave
- 206 S High St
- 306 S High St
- 204 S High St
- 203 S College Ave
- 201 S College Ave
- 205 E Poplar St
- 203 E Poplar St
- 400 S High St
- 207 E Poplar St
Your Personal Tour Guide
Ask me questions while you tour the home.