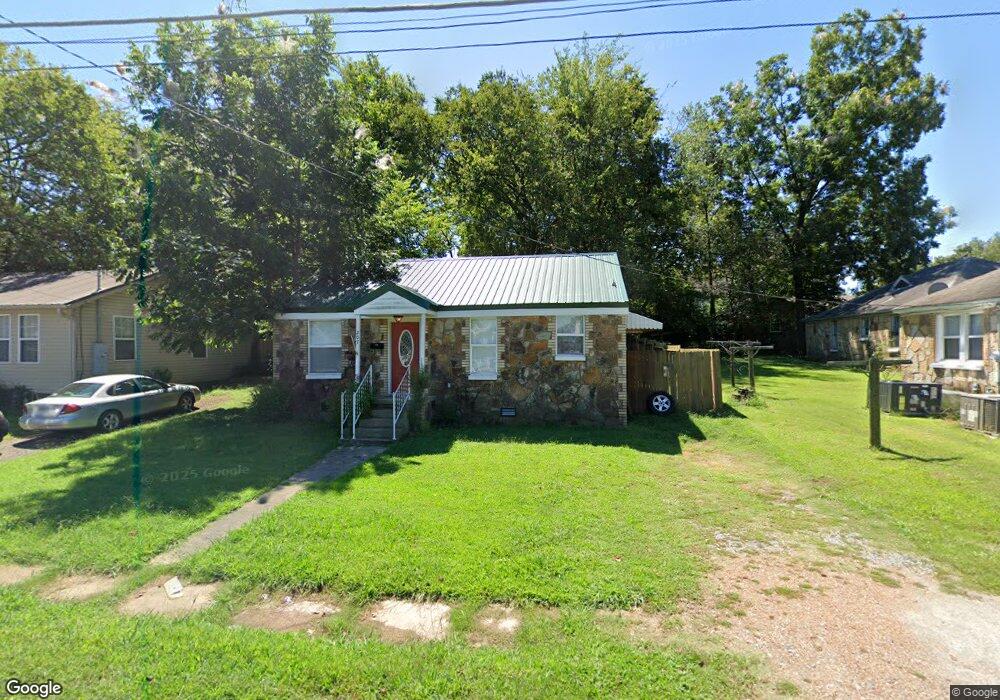
207 E Moore Ave Searcy, AR 72143
Estimated Value: $89,000 - $112,000
2
Beds
1
Bath
850
Sq Ft
$113/Sq Ft
Est. Value
About This Home
This home is located at 207 E Moore Ave, Searcy, AR 72143 and is currently estimated at $95,722, approximately $112 per square foot. 207 E Moore Ave is a home located in White County with nearby schools including Sidney Deener Elementary School, Southwest Middle School, and Ahlf Junior High School.
Ownership History
Date
Name
Owned For
Owner Type
Purchase Details
Closed on
Dec 10, 2010
Sold by
Jaybird Development Llc and Velasco Matt
Bought by
Lindsey Kevin and Lindsey Amanda
Current Estimated Value
Home Financials for this Owner
Home Financials are based on the most recent Mortgage that was taken out on this home.
Original Mortgage
$34,000
Outstanding Balance
$22,287
Interest Rate
4.22%
Mortgage Type
Future Advance Clause Open End Mortgage
Estimated Equity
$73,435
Purchase Details
Closed on
May 28, 2010
Bought by
Jaybird
Home Financials for this Owner
Home Financials are based on the most recent Mortgage that was taken out on this home.
Original Mortgage
$17,500
Interest Rate
5.02%
Mortgage Type
Future Advance Clause Open End Mortgage
Purchase Details
Closed on
Aug 22, 2003
Bought by
Kamerman
Purchase Details
Closed on
Sep 22, 1999
Bought by
Degroat Laurence B and Degroat Jana L
Purchase Details
Closed on
Mar 8, 1983
Bought by
Dillin
Purchase Details
Closed on
Aug 3, 1981
Bought by
Duncan
Create a Home Valuation Report for This Property
The Home Valuation Report is an in-depth analysis detailing your home's value as well as a comparison with similar homes in the area
Purchase History
| Date | Buyer | Sale Price | Title Company |
|---|---|---|---|
| Lindsey Kevin | $18,000 | -- | |
| Jaybird | $22,000 | -- | |
| Kamerman | $32,000 | -- | |
| Degroat Laurence B | $26,000 | -- | |
| Dillin | -- | -- | |
| Duncan | -- | -- |
Source: Public Records
Mortgage History
| Date | Status | Borrower | Loan Amount |
|---|---|---|---|
| Open | Lindsey Kevin | $34,000 | |
| Previous Owner | Jaybird | $17,500 |
Source: Public Records
Tax History
| Year | Tax Paid | Tax Assessment Tax Assessment Total Assessment is a certain percentage of the fair market value that is determined by local assessors to be the total taxable value of land and additions on the property. | Land | Improvement |
|---|---|---|---|---|
| 2025 | $374 | $9,220 | $1,400 | $7,820 |
| 2024 | $374 | $9,220 | $1,400 | $7,820 |
| 2023 | $374 | $9,220 | $1,400 | $7,820 |
| 2022 | $303 | $9,220 | $1,400 | $7,820 |
| 2021 | $278 | $9,220 | $1,400 | $7,820 |
| 2020 | $253 | $6,220 | $1,100 | $5,120 |
| 2019 | $253 | $6,220 | $1,100 | $5,120 |
| 2018 | $253 | $6,220 | $1,100 | $5,120 |
| 2017 | $253 | $6,220 | $1,100 | $5,120 |
| 2016 | $253 | $6,220 | $1,100 | $5,120 |
| 2015 | $261 | $6,420 | $1,680 | $4,740 |
| 2014 | -- | $6,420 | $1,680 | $4,740 |
Source: Public Records
Map
Nearby Homes
- 508 and 510 N Oak St
- 410 Virgil Ave
- 407 E Market Ave
- 307 E Center Ave
- 506 N Fir St
- 506 N Pecan St
- 205 W Woodruff Ave
- 610 W Center Ave
- 300 N Clinic St
- 409 S Spring St
- 505 W Park Ave
- 601 N Hickory St
- 1108 Dobbins Dr
- 1111 E River Ave
- 17 acres off Arkansas 16
- 2050 Arkansas 16
- 510 S Maple St
- 212 Chrisp Ave
- 1408 Tulip Ave
- 1404 Fox Dr
- 209 E Moore Ave
- 610 N Main St Unit 610
- 612 N Main St Unit 612
- 610 & 612 N Main
- 604 N Main St
- 613 N Locust St
- 609 N Locust St
- 603 N Locust St
- 600 N Main St
- 210 E Academy Ave
- 611 N Main St
- 701 N Main St
- 208 E Moore Ave
- N Locust
- 603 N Main St
- 603 N Main St
- 607 N Main St
- 601 N Main St
- E Academy
- 207 E Academy Ave
Your Personal Tour Guide
Ask me questions while you tour the home.