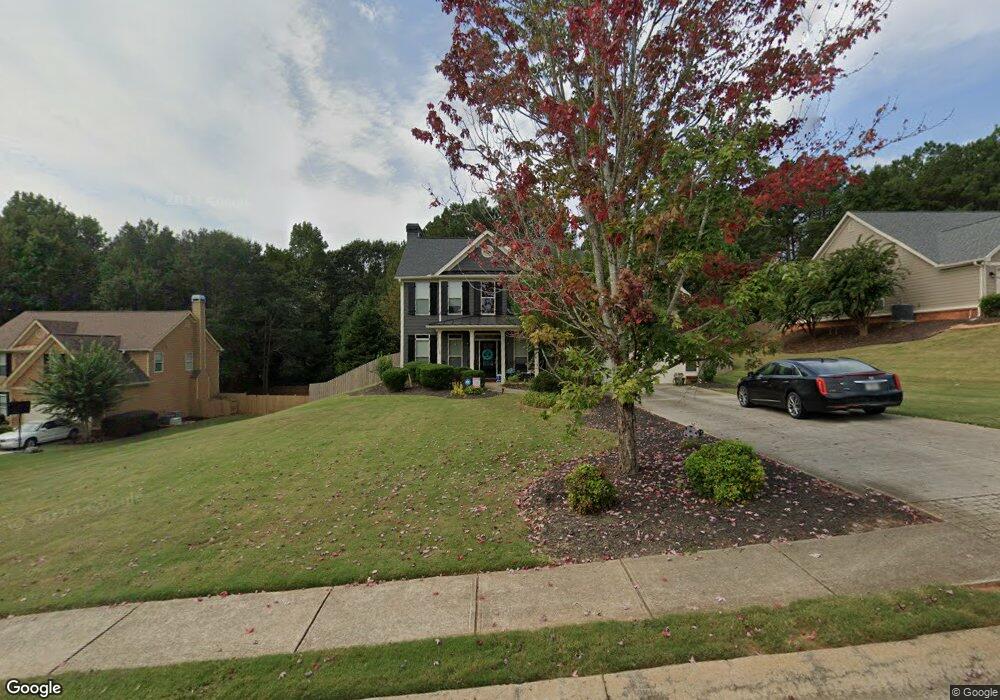
207 Fisher Ct Unit 57 Winder, GA 30680
Estimated Value: $421,805 - $461,000
4
Beds
3
Baths
2,381
Sq Ft
$189/Sq Ft
Est. Value
About This Home
This home is located at 207 Fisher Ct Unit 57, Winder, GA 30680 and is currently estimated at $449,951, approximately $188 per square foot. 207 Fisher Ct Unit 57 is a home located in Barrow County with nearby schools including Bramlett Elementary School, Russell Middle School, and Winder-Barrow High School.
Ownership History
Date
Name
Owned For
Owner Type
Purchase Details
Closed on
Jul 8, 2019
Sold by
Darnell Jonathan M
Bought by
Wright Crystal M and Rodeffer Berry M
Current Estimated Value
Home Financials for this Owner
Home Financials are based on the most recent Mortgage that was taken out on this home.
Original Mortgage
$218,700
Outstanding Balance
$191,601
Interest Rate
3.82%
Mortgage Type
New Conventional
Estimated Equity
$258,350
Purchase Details
Closed on
Oct 26, 2009
Sold by
Twin Oaks Construction Llc
Bought by
Darnell Jonathan M
Home Financials for this Owner
Home Financials are based on the most recent Mortgage that was taken out on this home.
Original Mortgage
$161,019
Interest Rate
4.93%
Mortgage Type
FHA
Purchase Details
Closed on
Jan 20, 2006
Sold by
Star Home Builders Inc
Bought by
Twin Oaks Construction Llc
Purchase Details
Closed on
Apr 7, 2005
Sold by
Montana Development Inc
Bought by
Star Home Builders Inc
Purchase Details
Closed on
Mar 4, 2004
Bought by
Montana Development Inc
Create a Home Valuation Report for This Property
The Home Valuation Report is an in-depth analysis detailing your home's value as well as a comparison with similar homes in the area
Home Values in the Area
Average Home Value in this Area
Purchase History
| Date | Buyer | Sale Price | Title Company |
|---|---|---|---|
| Wright Crystal M | $243,000 | -- | |
| Darnell Jonathan M | $164,000 | -- | |
| Twin Oaks Construction Llc | $45,000 | -- | |
| Star Home Builders Inc | $45,000 | -- | |
| Montana Development Inc | -- | -- |
Source: Public Records
Mortgage History
| Date | Status | Borrower | Loan Amount |
|---|---|---|---|
| Open | Wright Crystal M | $218,700 | |
| Previous Owner | Darnell Jonathan M | $161,019 |
Source: Public Records
Tax History Compared to Growth
Tax History
| Year | Tax Paid | Tax Assessment Tax Assessment Total Assessment is a certain percentage of the fair market value that is determined by local assessors to be the total taxable value of land and additions on the property. | Land | Improvement |
|---|---|---|---|---|
| 2024 | $3,629 | $144,684 | $33,600 | $111,084 |
| 2023 | $3,631 | $145,284 | $33,600 | $111,684 |
| 2022 | $3,426 | $117,866 | $28,800 | $89,066 |
| 2021 | $2,930 | $94,428 | $18,000 | $76,428 |
| 2020 | $2,935 | $94,428 | $18,000 | $76,428 |
| 2019 | $2,879 | $94,428 | $18,000 | $76,428 |
| 2018 | $2,850 | $94,428 | $18,000 | $76,428 |
| 2017 | $2,224 | $76,378 | $18,000 | $58,378 |
| 2016 | $1,904 | $64,453 | $18,000 | $46,453 |
| 2015 | $1,927 | $64,951 | $18,000 | $46,951 |
| 2014 | $1,691 | $56,270 | $8,820 | $47,450 |
| 2013 | -- | $51,046 | $8,820 | $42,226 |
Source: Public Records
Map
Nearby Homes
- 99 Mcmillian Ct
- 1931 Windstone Place
- 1929 Windstone Place
- 1557 Shadowstone Cir
- 1686 Shadowstone Ct
- 2839 Shadowstone Way
- 2858 Shadowstone Way
- 1202 Treemont Trace
- 1303 Windstone Ct
- 852 Georgetown Dr
- 1224 Treemont Trace
- 137 New Cut Rd
- 681 County Line Auburn Rd
- 787 Murphy Rd
- 731 Lincoln Dr
- 629 Dee Kennedy Rd
- 809 Custom Ln
- 207 Fisher Ct
- 205 Fisher Ct
- 209 Fisher Ct
- 209 Fisher Ct Unit 58
- 203 Fisher Ct
- 212 Fisher Ct
- 824 Caleb Dr
- 0 Fisher Ct Unit 7473568
- 0 Fisher Ct Unit 8663824
- 0 Fisher Ct Unit 9002371
- 0 Fisher Ct Unit 7564687
- 0 Fisher Ct Unit 7565314
- 0 Fisher Ct Unit 8472091
- 822 Caleb Dr
- 206 Fisher Ct
- 201 Fisher Ct
- 820 Caleb Dr
- 820 Caleb Dr Unit 51
- 204 Fisher Ct
- 826 Caleb Dr