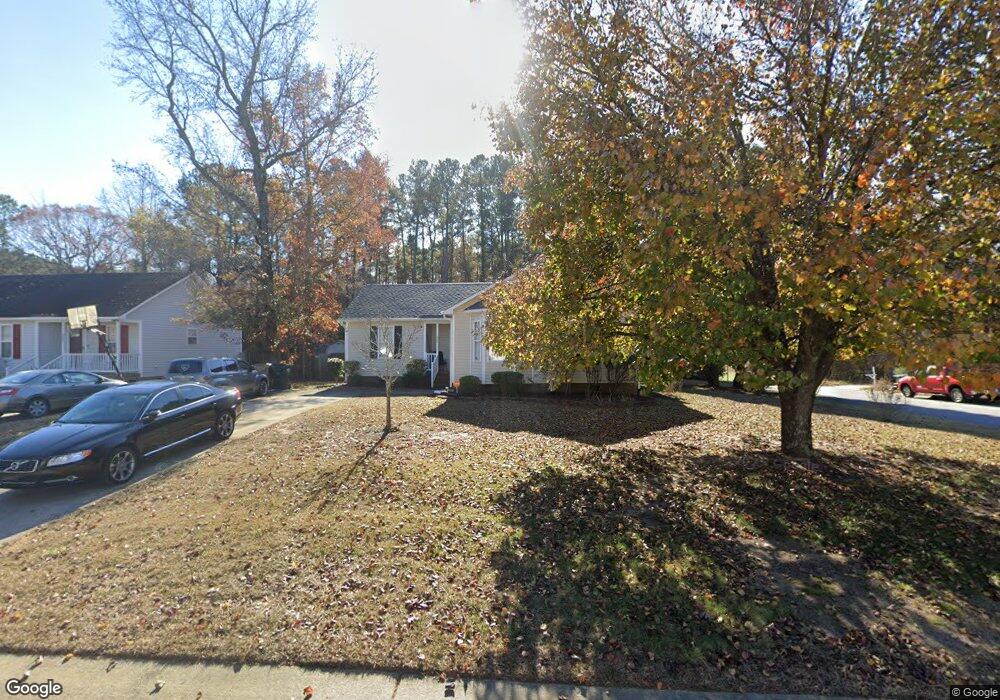
207 Gracie Ln Clayton, NC 27520
Community Park NeighborhoodEstimated Value: $270,000 - $280,852
3
Beds
2
Baths
1,299
Sq Ft
$213/Sq Ft
Est. Value
About This Home
This home is located at 207 Gracie Ln, Clayton, NC 27520 and is currently estimated at $276,463, approximately $212 per square foot. 207 Gracie Ln is a home located in Johnston County with nearby schools including West Clayton Elementary School, Clayton Middle School, and Clayton High.
Ownership History
Date
Name
Owned For
Owner Type
Purchase Details
Closed on
Apr 17, 2018
Sold by
Braswell Rachel and Braswell Matthew
Bought by
Allen Gregory M and Allen Janet H
Current Estimated Value
Home Financials for this Owner
Home Financials are based on the most recent Mortgage that was taken out on this home.
Original Mortgage
$144,000
Outstanding Balance
$123,636
Interest Rate
4.37%
Mortgage Type
Adjustable Rate Mortgage/ARM
Estimated Equity
$152,827
Purchase Details
Closed on
May 30, 2014
Sold by
Fannie Mae
Bought by
Seay Rachel
Home Financials for this Owner
Home Financials are based on the most recent Mortgage that was taken out on this home.
Original Mortgage
$113,000
Interest Rate
4.5%
Mortgage Type
Adjustable Rate Mortgage/ARM
Purchase Details
Closed on
Nov 15, 2013
Sold by
Foss John R and Foss Heidi J
Bought by
Federal National Mortgage Association
Create a Home Valuation Report for This Property
The Home Valuation Report is an in-depth analysis detailing your home's value as well as a comparison with similar homes in the area
Home Values in the Area
Average Home Value in this Area
Purchase History
| Date | Buyer | Sale Price | Title Company |
|---|---|---|---|
| Allen Gregory M | $160,000 | None Available | |
| Seay Rachel | -- | None Available | |
| Federal National Mortgage Association | $90,407 | None Available |
Source: Public Records
Mortgage History
| Date | Status | Borrower | Loan Amount |
|---|---|---|---|
| Open | Allen Gregory M | $144,000 | |
| Previous Owner | Seay Rachel | $113,000 |
Source: Public Records
Tax History Compared to Growth
Tax History
| Year | Tax Paid | Tax Assessment Tax Assessment Total Assessment is a certain percentage of the fair market value that is determined by local assessors to be the total taxable value of land and additions on the property. | Land | Improvement |
|---|---|---|---|---|
| 2025 | $2,680 | $265,390 | $80,000 | $185,390 |
| 2024 | $1,990 | $150,730 | $52,000 | $98,730 |
| 2023 | $1,944 | $150,730 | $52,000 | $98,730 |
| 2022 | $2,005 | $150,730 | $52,000 | $98,730 |
| 2021 | $1,975 | $150,730 | $52,000 | $98,730 |
| 2020 | $2,020 | $150,730 | $52,000 | $98,730 |
| 2019 | $2,020 | $150,730 | $52,000 | $98,730 |
| 2018 | $1,661 | $122,130 | $34,000 | $88,130 |
| 2017 | $1,624 | $122,130 | $34,000 | $88,130 |
| 2016 | $1,624 | $122,130 | $34,000 | $88,130 |
| 2015 | $1,594 | $122,130 | $34,000 | $88,130 |
| 2014 | $1,594 | $122,130 | $34,000 | $88,130 |
Source: Public Records
Map
Nearby Homes
- 120 Ses Dr
- 479 Winding Wood Dr
- 200 Hocutt Dr
- 342 Durwin Ln
- 200 Waterford Dr
- 212 Wexford Dr
- 128 Glengariff Ln
- 316 Waterford Dr
- 215 W Moss Creek Dr
- 1812 Parkside Village Dr
- 34 Belhaven Dr
- 117 Butternut Ln
- 113 Sturbridge Dr Unit 113
- 129 Sturbridge Dr Unit 15
- 113 Butternut Ln
- 3069 Buttonwood Ln
- 1509 Kenmore Dr
- 1029 Cove Cir
- 1261 Grovewood Dr
- 2845 Bennington Dr