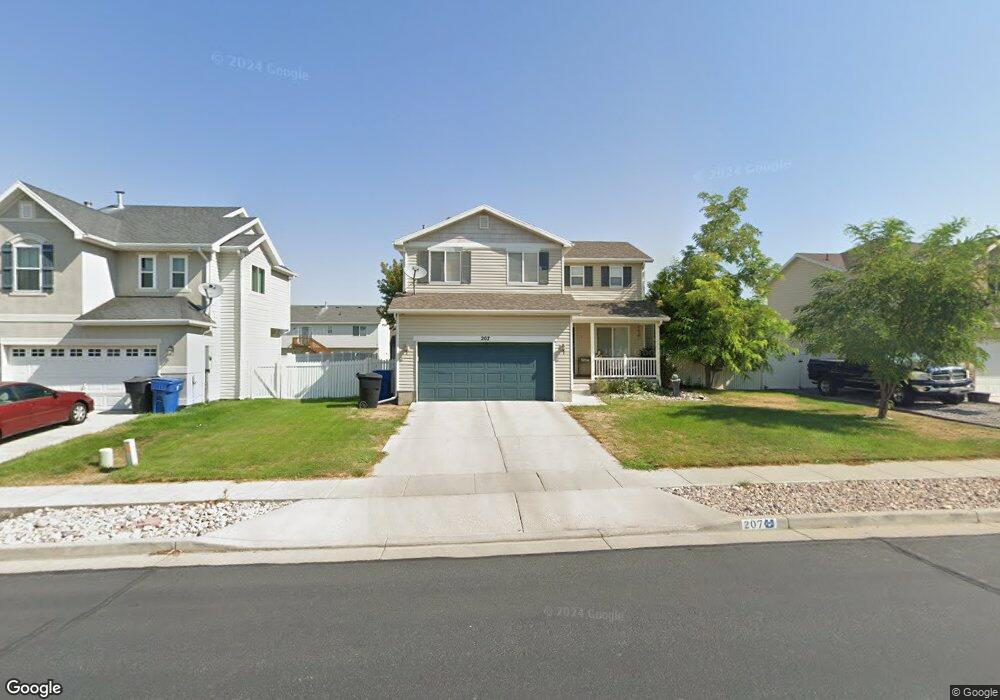
207 Heidleberg Place Tooele, UT 84074
Estimated Value: $442,000 - $453,000
4
Beds
3
Baths
1,985
Sq Ft
$225/Sq Ft
Est. Value
About This Home
This home is located at 207 Heidleberg Place, Tooele, UT 84074 and is currently estimated at $447,153, approximately $225 per square foot. 207 Heidleberg Place is a home located in Tooele County with nearby schools including Rose Springs Elementary School, Clarke N. Johnsen Junior High School, and Stansbury High School.
Ownership History
Date
Name
Owned For
Owner Type
Purchase Details
Closed on
Jul 10, 2017
Sold by
Seeley Jessica R
Bought by
Seeley Jessica
Current Estimated Value
Home Financials for this Owner
Home Financials are based on the most recent Mortgage that was taken out on this home.
Original Mortgage
$70,000
Outstanding Balance
$37,019
Interest Rate
3.94%
Mortgage Type
New Conventional
Estimated Equity
$410,134
Purchase Details
Closed on
Nov 17, 2011
Sold by
Seeley Michael R and Seeley Jessica
Bought by
Seeley Michael R and Seeley Jessica
Purchase Details
Closed on
Aug 24, 2005
Sold by
Head Gaylynn
Bought by
Seeley Michael R and Seeley Jessica
Home Financials for this Owner
Home Financials are based on the most recent Mortgage that was taken out on this home.
Original Mortgage
$22,800
Interest Rate
5.61%
Mortgage Type
Stand Alone Second
Create a Home Valuation Report for This Property
The Home Valuation Report is an in-depth analysis detailing your home's value as well as a comparison with similar homes in the area
Home Values in the Area
Average Home Value in this Area
Purchase History
| Date | Buyer | Sale Price | Title Company |
|---|---|---|---|
| Seeley Jessica | -- | Vanguard Title Insurance Age | |
| Seeley Michael R | -- | None Available | |
| Seeley Michael R | -- | Equity Title |
Source: Public Records
Mortgage History
| Date | Status | Borrower | Loan Amount |
|---|---|---|---|
| Open | Seeley Jessica | $70,000 | |
| Closed | Seeley Michael R | $22,800 |
Source: Public Records
Tax History Compared to Growth
Tax History
| Year | Tax Paid | Tax Assessment Tax Assessment Total Assessment is a certain percentage of the fair market value that is determined by local assessors to be the total taxable value of land and additions on the property. | Land | Improvement |
|---|---|---|---|---|
| 2025 | $3,236 | $409,070 | $132,000 | $277,070 |
| 2024 | $3,642 | $233,976 | $72,600 | $161,376 |
| 2023 | $3,642 | $226,062 | $77,550 | $148,512 |
| 2022 | $2,815 | $225,887 | $63,360 | $162,527 |
| 2021 | $2,448 | $162,254 | $55,110 | $107,144 |
| 2020 | $2,328 | $269,787 | $74,800 | $194,987 |
| 2019 | $2,270 | $258,716 | $74,800 | $183,916 |
| 2018 | $2,070 | $226,075 | $40,000 | $186,075 |
| 2017 | $1,880 | $217,214 | $40,000 | $177,214 |
| 2016 | $1,625 | $106,754 | $22,000 | $84,754 |
| 2015 | $1,625 | $101,957 | $0 | $0 |
| 2014 | -- | $101,957 | $0 | $0 |
Source: Public Records
Map
Nearby Homes
- 5493 Lorraine Way
- 198 Clermont Ln
- 5502 Ardennes Way
- 5546 Ardennes Way
- 5581 Brienne Way
- 5454 Heather Way
- 5489 Hampton Way
- 5229 N Ventura Cir
- 5419 Heather Way
- 361 E Ventura Blvd
- 39 Strasbourg Ln
- 5634 Miller Cir
- 5226 N Ventura Cir
- 107 Pebble Beach Dr
- 464 Winchester Drive'
- 45 W Streams Edge Way
- 266 Country Club Dr
- 907 W Kingfisher Rd
- 923 W Kingfisher Rd
- 5129 N Cambridge Way
- 217 Heidelberg Place
- 197 Heidleberg Place
- 217 Heidleberg Place
- 197 Heidelberg Place
- 208 Cherbourg Ln
- 198 Cherbourg Ln
- 218 Cherbourg Ln
- 189 Heidleberg Place
- 189 Heidelberg Place
- 208 Heidleberg Place
- 216 Heidelberg Place
- 216 Heidleberg Place
- 190 Cherbourg Ln
- 198 Heidelberg Place
- 198 Heidleberg Place
- 224 Heidleberg Place
- 5456 Lucerne Place
- 179 Heidleberg Place
- 179 Heidelberg Place
- 190 Heidleberg Place