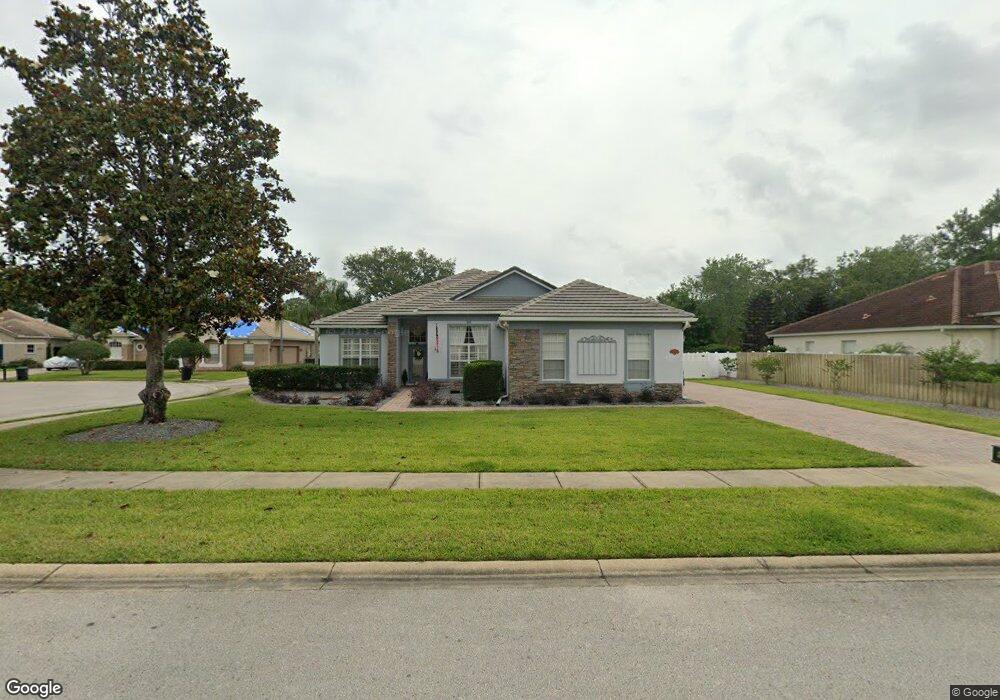
207 Juniper Ridge Ct Sanford, FL 32771
Estimated Value: $503,001 - $598,000
4
Beds
2
Baths
3,020
Sq Ft
$180/Sq Ft
Est. Value
About This Home
This home is located at 207 Juniper Ridge Ct, Sanford, FL 32771 and is currently estimated at $543,750, approximately $180 per square foot. 207 Juniper Ridge Ct is a home located in Seminole County with nearby schools including Wilson Elementary School, Bentley Elementary School, and Idyllwilde Elementary School.
Ownership History
Date
Name
Owned For
Owner Type
Purchase Details
Closed on
Feb 1, 2024
Sold by
Porter Kathleen A
Bought by
Porter Kathleen A
Current Estimated Value
Purchase Details
Closed on
Aug 31, 2016
Sold by
Stoner Cynthia M and Stoner John
Bought by
Porter Kathleen A
Home Financials for this Owner
Home Financials are based on the most recent Mortgage that was taken out on this home.
Original Mortgage
$224,000
Interest Rate
3.43%
Mortgage Type
New Conventional
Purchase Details
Closed on
Feb 14, 2006
Sold by
Bovis Home Florida Llc
Bought by
Stoner John and Stoner Cynthia M
Home Financials for this Owner
Home Financials are based on the most recent Mortgage that was taken out on this home.
Original Mortgage
$294,460
Interest Rate
5.75%
Mortgage Type
Fannie Mae Freddie Mac
Purchase Details
Closed on
Dec 1, 2003
Bought by
Porter Kathleen A
Purchase Details
Closed on
Oct 1, 2003
Bought by
Porter Kathleen A
Create a Home Valuation Report for This Property
The Home Valuation Report is an in-depth analysis detailing your home's value as well as a comparison with similar homes in the area
Home Values in the Area
Average Home Value in this Area
Purchase History
| Date | Buyer | Sale Price | Title Company |
|---|---|---|---|
| Porter Kathleen A | -- | None Listed On Document | |
| Porter Kathleen A | $280,000 | None Available | |
| Porter Kathleen A | $280,000 | None Available | |
| Stoner John | $380,000 | Fidelity Natl Title Ins Co | |
| Porter Kathleen A | $100 | -- | |
| Porter Kathleen A | $100 | -- |
Source: Public Records
Mortgage History
| Date | Status | Borrower | Loan Amount |
|---|---|---|---|
| Previous Owner | Porter Kathleen A | $224,000 | |
| Previous Owner | Stoner John | $294,460 |
Source: Public Records
Tax History Compared to Growth
Tax History
| Year | Tax Paid | Tax Assessment Tax Assessment Total Assessment is a certain percentage of the fair market value that is determined by local assessors to be the total taxable value of land and additions on the property. | Land | Improvement |
|---|---|---|---|---|
| 2024 | $3,230 | $261,427 | -- | -- |
| 2023 | $3,023 | $244,104 | $0 | $0 |
| 2021 | $2,857 | $229,173 | $0 | $0 |
| 2020 | $2,832 | $226,009 | $0 | $0 |
| 2019 | $2,803 | $220,928 | $0 | $0 |
| 2018 | $2,772 | $216,809 | $0 | $0 |
| 2017 | $2,753 | $212,350 | $0 | $0 |
| 2016 | $2,323 | $220,396 | $0 | $0 |
| 2015 | $2,350 | $175,043 | $0 | $0 |
| 2014 | $2,118 | $173,654 | $0 | $0 |
Source: Public Records
Map
Nearby Homes
- 321 Kingsbury Ave
- 5100 Linwood Cir
- 5091 Great Oak Ln
- 5055 Knotty Pine Ct
- 5138 Fiorella Ln
- 955 Belles Ferry Loop
- 5413 Via Veneto Ct
- 5637 Siracusa Ln
- 5378 Glenlake Place
- 5621 Siracusa Ln
- 5373 Via Appia Way
- 5632 Siracusa Ln
- 5610 Wilson Rd
- 417 Livorno Way
- 5705 Climbing Rose Way
- 545 Telfair Square Ct
- 196 Meadow Beauty Terrace
- 299 Terracina Dr
- 458 Ellis Square Ct
- 5393 Shoreline Cir
- 203 Juniper Ridge Ct
- 211 Juniper Ridge Ct
- 208 Juniper Ridge Ct
- 212 Juniper Ridge Ct
- 219 Juniper Ridge Ct
- 220 Juniper Ridge Ct
- 216 Juniper Ridge Ct
- 428 Kimberly Ct
- 300 Kimberly Ct
- 5481 Wayside Dr
- 201 Brynwood Ln
- 205 Brynwood Ln
- 301 Kimberly Ct
- 209 Brynwood Ln
- 185 S Henderson Ln
- 424 Kimberly Ct
- 304 Kimberly Ct
- 425 Kimberly Ct
- 213 Brynwood Ln
- 305 Kimberly Ct