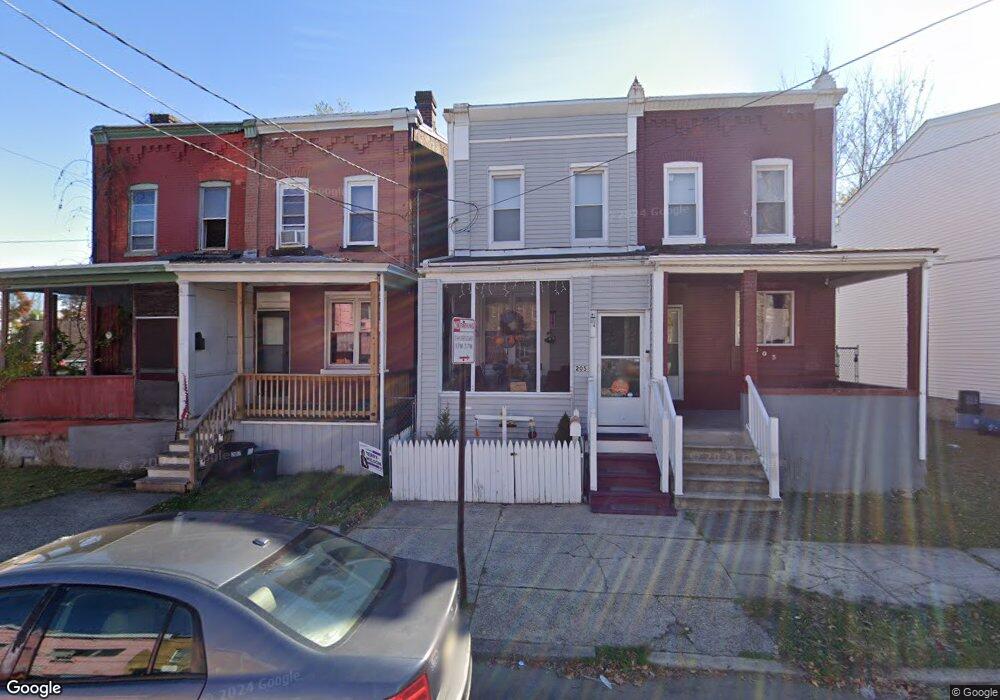
207 Locust St Trenton, NJ 08609
Greenwood & Hamilton NeighborhoodEstimated Value: $151,000 - $242,000
3
Beds
1
Bath
1,241
Sq Ft
$156/Sq Ft
Est. Value
About This Home
This home is located at 207 Locust St, Trenton, NJ 08609 and is currently estimated at $193,667, approximately $156 per square foot. 207 Locust St is a home located in Mercer County with nearby schools including P.J. Hill Elementary School, Grant Elementary School, and Dr. Martin Luther King Middle School.
Ownership History
Date
Name
Owned For
Owner Type
Purchase Details
Closed on
May 7, 2009
Sold by
S2 Nj Llc
Bought by
Padalino Vincent
Current Estimated Value
Purchase Details
Closed on
Feb 17, 2009
Sold by
Coluccio Anna H and Fuss Marion Fuss
Bought by
S2 New Jersey
Home Financials for this Owner
Home Financials are based on the most recent Mortgage that was taken out on this home.
Interest Rate
5.16%
Create a Home Valuation Report for This Property
The Home Valuation Report is an in-depth analysis detailing your home's value as well as a comparison with similar homes in the area
Home Values in the Area
Average Home Value in this Area
Purchase History
| Date | Buyer | Sale Price | Title Company |
|---|---|---|---|
| Padalino Vincent | $6,000 | Emerald Title Agency | |
| S2 New Jersey | -- | -- |
Source: Public Records
Mortgage History
| Date | Status | Borrower | Loan Amount |
|---|---|---|---|
| Previous Owner | S2 New Jersey | -- |
Source: Public Records
Tax History Compared to Growth
Tax History
| Year | Tax Paid | Tax Assessment Tax Assessment Total Assessment is a certain percentage of the fair market value that is determined by local assessors to be the total taxable value of land and additions on the property. | Land | Improvement |
|---|---|---|---|---|
| 2025 | $2,059 | $35,500 | $5,700 | $29,800 |
| 2024 | $1,976 | $35,500 | $5,700 | $29,800 |
| 2023 | $1,976 | $35,500 | $5,700 | $29,800 |
| 2022 | $1,938 | $35,500 | $5,700 | $29,800 |
| 2021 | $1,971 | $35,500 | $5,700 | $29,800 |
| 2020 | $1,965 | $35,500 | $5,700 | $29,800 |
| 2019 | $1,933 | $35,500 | $5,700 | $29,800 |
| 2018 | $1,851 | $35,500 | $5,700 | $29,800 |
| 2017 | $1,759 | $35,500 | $5,700 | $29,800 |
| 2016 | $2,261 | $39,300 | $5,800 | $33,500 |
| 2015 | $2,253 | $39,300 | $5,800 | $33,500 |
| 2014 | $2,242 | $39,300 | $5,800 | $33,500 |
Source: Public Records
Map
Nearby Homes