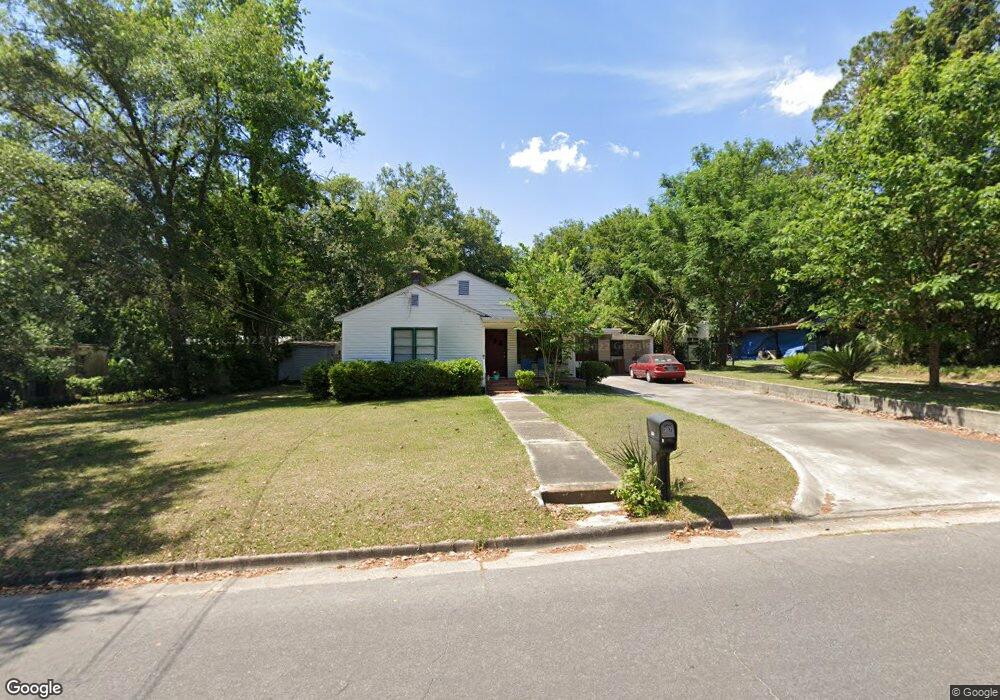
207 Magnolia St Waycross, GA 31501
Estimated Value: $139,000 - $180,000
3
Beds
2
Baths
2,024
Sq Ft
$77/Sq Ft
Est. Value
About This Home
This home is located at 207 Magnolia St, Waycross, GA 31501 and is currently estimated at $155,494, approximately $76 per square foot. 207 Magnolia St is a home located in Ware County with nearby schools including Williams Heights Elementary School, Waycross Middle School, and Ware County High School.
Ownership History
Date
Name
Owned For
Owner Type
Purchase Details
Closed on
Mar 2, 2023
Sold by
Herrin Donna Jo Crews
Bought by
Nimi Properties Llc
Current Estimated Value
Home Financials for this Owner
Home Financials are based on the most recent Mortgage that was taken out on this home.
Original Mortgage
$110,500
Interest Rate
6.13%
Mortgage Type
Mortgage Modification
Purchase Details
Closed on
Jul 27, 2017
Sold by
Crews Carolyn Johnson
Bought by
Herrin Donna Jo Crews
Purchase Details
Closed on
Apr 10, 2006
Sold by
Lacefield Sally P
Bought by
Crews Warren R and Herrin Donna Jo
Purchase Details
Closed on
Aug 21, 2003
Sold by
Richmond Commercial Investemen
Bought by
Lacefield Sally P
Purchase Details
Closed on
Feb 21, 2003
Sold by
Waycross Properties
Bought by
Richmond Commercial Investements Inc
Purchase Details
Closed on
Jun 1, 2000
Sold by
Richmond Commercial
Bought by
Waycross Properties
Purchase Details
Closed on
Oct 30, 1995
Bought by
Richmond Commercial
Purchase Details
Closed on
Dec 24, 1986
Create a Home Valuation Report for This Property
The Home Valuation Report is an in-depth analysis detailing your home's value as well as a comparison with similar homes in the area
Home Values in the Area
Average Home Value in this Area
Purchase History
| Date | Buyer | Sale Price | Title Company |
|---|---|---|---|
| Nimi Properties Llc | $71,500 | -- | |
| Herrin Donna Jo Crews | -- | -- | |
| Herrin Donna Jo Crews | -- | -- | |
| Crews Warren R | $68,500 | -- | |
| Lacefield Sally P | $56,000 | -- | |
| Richmond Commercial Investements Inc | -- | -- | |
| Waycross Properties | -- | -- | |
| Richmond Commercial | $49,000 | -- | |
| -- | $33,000 | -- |
Source: Public Records
Mortgage History
| Date | Status | Borrower | Loan Amount |
|---|---|---|---|
| Closed | Nimi Properties Llc | $110,500 |
Source: Public Records
Tax History Compared to Growth
Tax History
| Year | Tax Paid | Tax Assessment Tax Assessment Total Assessment is a certain percentage of the fair market value that is determined by local assessors to be the total taxable value of land and additions on the property. | Land | Improvement |
|---|---|---|---|---|
| 2024 | $2,243 | $56,274 | $3,040 | $53,234 |
| 2023 | $986 | $55,281 | $2,477 | $52,804 |
| 2022 | $1,483 | $55,281 | $2,477 | $52,804 |
| 2021 | $1,540 | $45,896 | $2,477 | $43,419 |
| 2020 | $1,552 | $39,669 | $2,477 | $37,192 |
| 2019 | $1,574 | $38,371 | $2,477 | $35,894 |
| 2018 | $1,655 | $37,074 | $2,477 | $34,597 |
| 2017 | $1,278 | $37,074 | $2,477 | $34,597 |
| 2016 | $1,278 | $37,074 | $2,477 | $34,597 |
| 2015 | $1,285 | $37,073 | $2,477 | $34,597 |
| 2014 | $1,283 | $37,074 | $2,477 | $34,597 |
| 2013 | -- | $33,241 | $2,476 | $30,764 |
Source: Public Records
Map
Nearby Homes
- 502 Dewey St
- 415 Dewey St
- 924 Highsmith St
- 418 Reed St
- 506 Magnolia Dr
- 306 Lee Ave
- 807 College St
- 0 Goodwin St
- 808 Satilla Blvd
- 310 Butler St
- 511 Richmond Ave
- 1405 Grove Ave
- 301 Riverside Dr
- 1101 Cherokee Dr
- 705 Gilmore St
- 713 Magnolia Dr
- 615 Morton Ave
- 511 Riverside Dr
- 1504 Habersham Dr
- 805 Brunel St