Estimated Value: $603,902 - $672,000
3
Beds
3
Baths
2,412
Sq Ft
$260/Sq Ft
Est. Value
About This Home
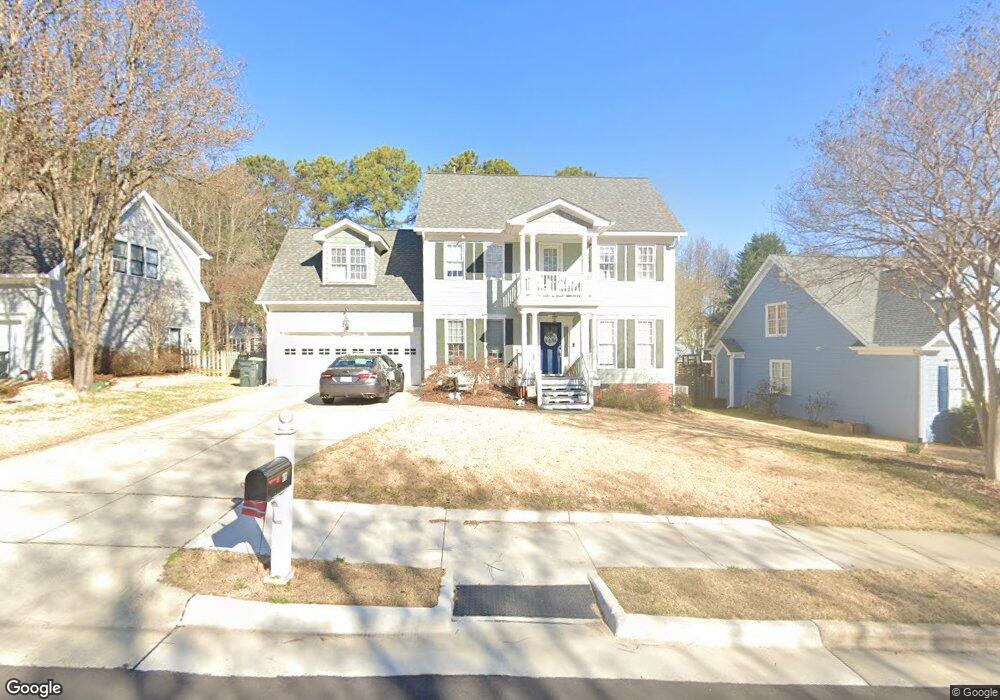
This home is located at 207 Maple Creek Ct, Apex, NC 27502 and is currently estimated at $628,226, approximately $260 per square foot. 207 Maple Creek Ct is a home located in Wake County with nearby schools including Scotts Ridge Elementary School, Apex Middle, and Apex High School.
Ownership History
Date
Name
Owned For
Owner Type
Purchase Details
Closed on
Oct 14, 2002
Sold by
Bank Of New York
Bought by
Vereckey Drue and Vereckey Christine Byrd
Current Estimated Value
Home Financials for this Owner
Home Financials are based on the most recent Mortgage that was taken out on this home.
Original Mortgage
$180,000
Outstanding Balance
$75,739
Interest Rate
6.21%
Estimated Equity
$552,487
Purchase Details
Closed on
Dec 21, 2001
Sold by
Cheshaek Mary A
Bought by
Bank Of New York
Purchase Details
Closed on
Nov 20, 1998
Sold by
Blankenship & Mussler Construction Inc
Bought by
Cheshaek Mary A
Home Financials for this Owner
Home Financials are based on the most recent Mortgage that was taken out on this home.
Original Mortgage
$214,462
Interest Rate
6.39%
Create a Home Valuation Report for This Property
The Home Valuation Report is an in-depth analysis detailing your home's value as well as a comparison with similar homes in the area
Home Values in the Area
Average Home Value in this Area
Purchase History
| Date | Buyer | Sale Price | Title Company |
|---|---|---|---|
| Vereckey Drue | $225,000 | -- | |
| Bank Of New York | $220,500 | -- | |
| Cheshaek Mary A | $226,000 | -- |
Source: Public Records
Mortgage History
| Date | Status | Borrower | Loan Amount |
|---|---|---|---|
| Open | Vereckey Drue | $180,000 | |
| Previous Owner | Cheshaek Mary A | $214,462 |
Source: Public Records
Tax History Compared to Growth
Tax History
| Year | Tax Paid | Tax Assessment Tax Assessment Total Assessment is a certain percentage of the fair market value that is determined by local assessors to be the total taxable value of land and additions on the property. | Land | Improvement |
|---|---|---|---|---|
| 2025 | $4,939 | $563,408 | $180,000 | $383,408 |
| 2024 | $4,829 | $563,408 | $180,000 | $383,408 |
| 2023 | $3,970 | $360,033 | $80,000 | $280,033 |
| 2022 | $3,727 | $360,033 | $80,000 | $280,033 |
| 2021 | $3,584 | $360,033 | $80,000 | $280,033 |
| 2020 | $3,548 | $360,033 | $80,000 | $280,033 |
| 2019 | $3,415 | $298,963 | $80,000 | $218,963 |
| 2018 | $3,217 | $298,963 | $80,000 | $218,963 |
| 2017 | $2,995 | $298,963 | $80,000 | $218,963 |
| 2016 | $2,951 | $298,963 | $80,000 | $218,963 |
| 2015 | $2,864 | $283,158 | $62,000 | $221,158 |
| 2014 | -- | $283,158 | $62,000 | $221,158 |
Source: Public Records
Map
Nearby Homes
- 104 Pine Tag Ct
- 402 Village Loop Dr
- 441 Heritage Village Ln
- 428 Heritage Village Ln
- 448 Heritage Village Ln
- 460 Heritage Village Ln
- 1311 Pendula Path
- 1773 Town Home Dr
- 541 Village Loop Dr
- 1131 Bungalow Park Dr
- 1042 Mica Lamp Ct
- 3014 Silky Dogwood Trail
- 1910 Woodall Crest Dr
- 103 Garden Side Way
- 2008 Silky Dogwood Trail
- 1880 Woodall Crest Dr
- 209 Homegate Cir
- 1706 Patterson Grove Rd
- 1208 Tartarian Trail
- 1844 Woodall Crest Dr
- 205 Maple Creek Ct
- 200 Cedar Trail Ln
- 104 Hickory Valley Ct
- 100 Hickory Valley Ct
- 204 Cedar Trail Ln
- 106 Hickory Valley Ct
- 203 Maple Creek Ct
- 300 Maple Creek Ct
- 202 Maple Creek Ct
- 401 Maple Creek Ct
- 500 Scotts Ridge Trail
- 104 Pine Cut Ln
- 502 Scotts Ridge Trail
- 201 Maple Creek Ct
- 105 Pine Cut Ln
- 203 Cedar Trail Ln
- 108 Hickory Valley Ct
- 200 Maple Creek Ct
- 400 Maple Creek Ct
- 300 Cedar Trail Ln