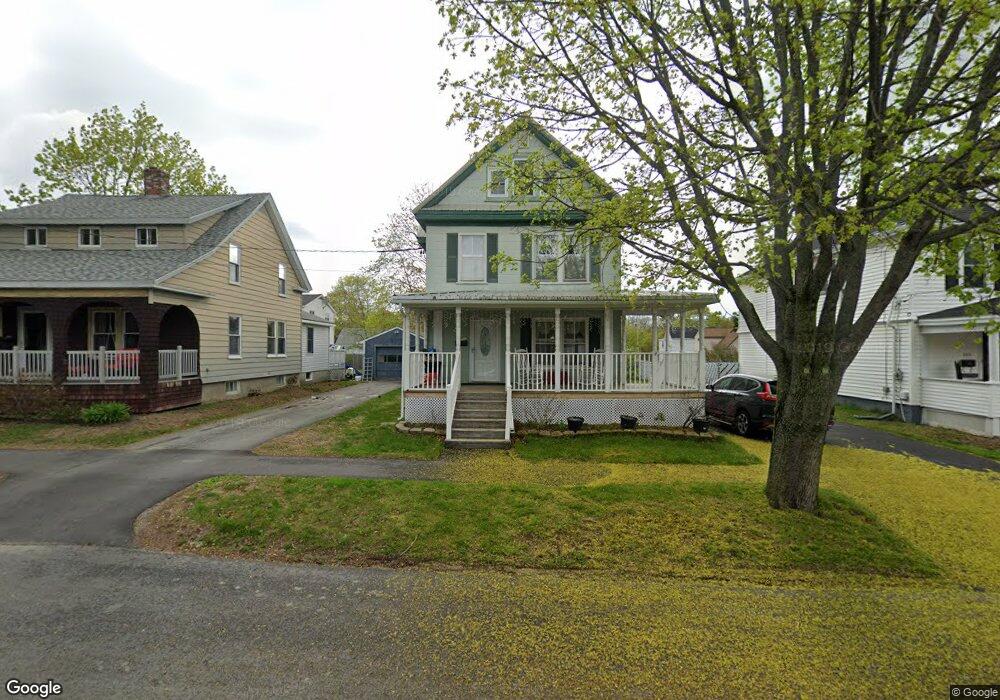
207 Maple St Bangor, ME 04401
Central Bangor NeighborhoodEstimated Value: $258,551 - $319,000
3
Beds
2
Baths
1,688
Sq Ft
$171/Sq Ft
Est. Value
About This Home
This home is located at 207 Maple St, Bangor, ME 04401 and is currently estimated at $288,388, approximately $170 per square foot. 207 Maple St is a home located in Penobscot County with nearby schools including Fruit Street School, Mary Snow School, and William S. Cohen School.
Ownership History
Date
Name
Owned For
Owner Type
Purchase Details
Closed on
Jun 16, 2014
Sold by
Fisher Matthew J
Bought by
Fisher Joseph D and Fisher Marty L
Current Estimated Value
Home Financials for this Owner
Home Financials are based on the most recent Mortgage that was taken out on this home.
Original Mortgage
$151,851
Outstanding Balance
$115,805
Interest Rate
4.27%
Mortgage Type
VA
Estimated Equity
$172,583
Purchase Details
Closed on
Jun 5, 2007
Sold by
Fisher Joseph D and Fisher Marty L
Bought by
Fisher Matthew J
Home Financials for this Owner
Home Financials are based on the most recent Mortgage that was taken out on this home.
Original Mortgage
$29,000
Interest Rate
6.54%
Mortgage Type
Unknown
Create a Home Valuation Report for This Property
The Home Valuation Report is an in-depth analysis detailing your home's value as well as a comparison with similar homes in the area
Home Values in the Area
Average Home Value in this Area
Purchase History
| Date | Buyer | Sale Price | Title Company |
|---|---|---|---|
| Fisher Joseph D | -- | -- | |
| Fisher Matthew J | -- | -- |
Source: Public Records
Mortgage History
| Date | Status | Borrower | Loan Amount |
|---|---|---|---|
| Open | Fisher Joseph D | $151,851 | |
| Closed | Fisher Matthew J | $168,800 | |
| Closed | Fisher Matthew J | $29,000 | |
| Closed | Fisher Matthew J | $124,000 |
Source: Public Records
Tax History
| Year | Tax Paid | Tax Assessment Tax Assessment Total Assessment is a certain percentage of the fair market value that is determined by local assessors to be the total taxable value of land and additions on the property. | Land | Improvement |
|---|---|---|---|---|
| 2024 | $4,155 | $224,000 | $20,900 | $203,100 |
| 2023 | $3,916 | $204,500 | $20,900 | $183,600 |
| 2022 | $3,637 | $178,300 | $20,900 | $157,400 |
| 2021 | $3,347 | $150,100 | $19,300 | $130,800 |
| 2020 | $3,396 | $146,400 | $19,300 | $127,100 |
| 2019 | $3,261 | $141,800 | $19,300 | $122,500 |
| 2018 | $3,082 | $134,300 | $19,300 | $115,000 |
| 2017 | $3,013 | $133,600 | $19,300 | $114,300 |
| 2016 | $2,941 | $130,700 | $19,300 | $111,400 |
| 2015 | $2,871 | $130,800 | $19,300 | $111,500 |
| 2014 | $2,856 | $131,000 | $19,300 | $111,700 |
| 2013 | $2,725 | $131,000 | $19,300 | $111,700 |
Source: Public Records
Map
Nearby Homes
- 203 Maple St
- 215 Maple St
- 260 Birch St
- 256 Birch St
- 208 Maple St
- 195 Maple St
- 250 Birch St
- 107 Mount Hope Ave
- 204 Maple St Unit 3
- 204 Maple St Unit 2
- 204 Maple St
- 189 Maple St
- 104 Mount Hope Ave
- 244 Birch St
- 89 Mount Hope Ave
- 200 Maple St
- 96 Mount Hope Ave
- 112 Mount Hope Ave
- 196 Maple St
- 251 Birch St
Your Personal Tour Guide
Ask me questions while you tour the home.