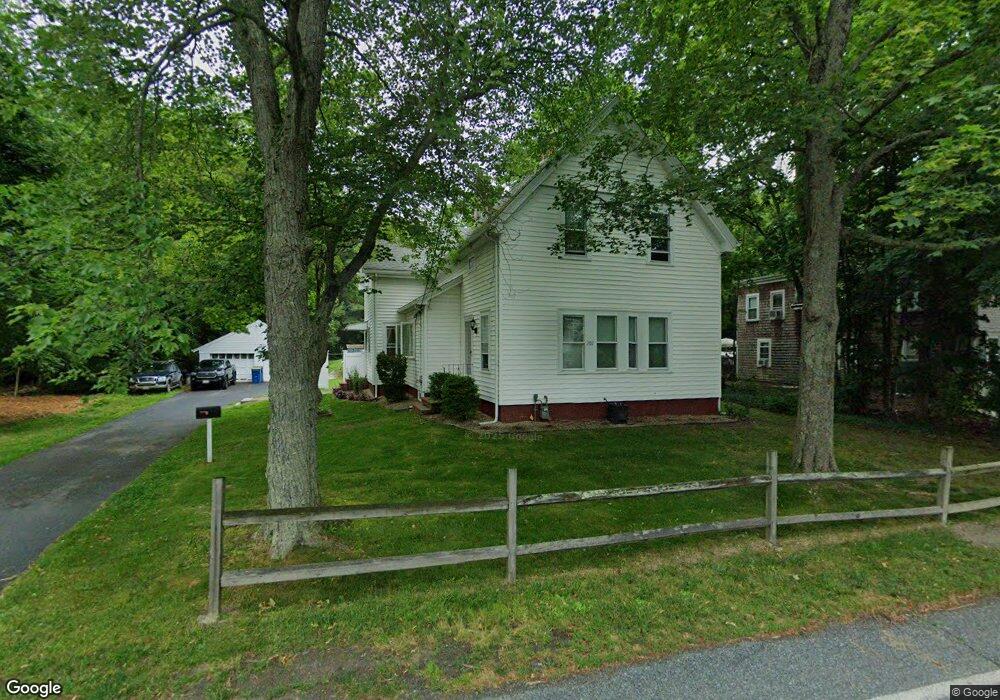
207 N Central St East Bridgewater, MA 02333
Estimated Value: $498,000 - $614,000
4
Beds
2
Baths
1,648
Sq Ft
$331/Sq Ft
Est. Value
About This Home
This home is located at 207 N Central St, East Bridgewater, MA 02333 and is currently estimated at $545,984, approximately $331 per square foot. 207 N Central St is a home located in Plymouth County with nearby schools including Central Elementary School, Gordon W Mitchell Middle School, and East Bridgewater Jr./Sr. High School.
Ownership History
Date
Name
Owned For
Owner Type
Purchase Details
Closed on
Feb 16, 2018
Sold by
Jarvinen Matthew C
Bought by
Jarvinen Matthew C and Berrini Kara E
Current Estimated Value
Purchase Details
Closed on
Nov 2, 2006
Sold by
Glaas Eric H and Glaas Wendy
Bought by
Jarvinen Matthew C
Home Financials for this Owner
Home Financials are based on the most recent Mortgage that was taken out on this home.
Original Mortgage
$337,335
Interest Rate
6.47%
Mortgage Type
Purchase Money Mortgage
Purchase Details
Closed on
Jul 18, 2002
Sold by
Attieh Richard and Attieh Georgette
Bought by
Glaas Wendy and Glaas Eric H
Purchase Details
Closed on
Jul 30, 1999
Sold by
Colleran Dolly
Bought by
Atiteh Richard and Atiteh Georgette
Create a Home Valuation Report for This Property
The Home Valuation Report is an in-depth analysis detailing your home's value as well as a comparison with similar homes in the area
Home Values in the Area
Average Home Value in this Area
Purchase History
| Date | Buyer | Sale Price | Title Company |
|---|---|---|---|
| Jarvinen Matthew C | -- | -- | |
| Jarvinen Matthew C | $340,000 | -- | |
| Glaas Wendy | $263,000 | -- | |
| Atiteh Richard | $20,000 | -- |
Source: Public Records
Mortgage History
| Date | Status | Borrower | Loan Amount |
|---|---|---|---|
| Previous Owner | Atiteh Richard | $335,965 | |
| Previous Owner | Atiteh Richard | $337,335 | |
| Previous Owner | Atiteh Richard | $120,000 |
Source: Public Records
Tax History Compared to Growth
Tax History
| Year | Tax Paid | Tax Assessment Tax Assessment Total Assessment is a certain percentage of the fair market value that is determined by local assessors to be the total taxable value of land and additions on the property. | Land | Improvement |
|---|---|---|---|---|
| 2025 | $5,319 | $389,100 | $196,500 | $192,600 |
| 2024 | $5,279 | $381,400 | $189,000 | $192,400 |
| 2023 | $5,238 | $362,500 | $189,000 | $173,500 |
| 2022 | $5,335 | $342,000 | $171,900 | $170,100 |
| 2021 | $0 | $315,500 | $165,200 | $150,300 |
| 2020 | $5,108 | $308,800 | $159,100 | $149,700 |
| 2019 | $5,124 | $291,800 | $152,100 | $139,700 |
| 2018 | $5,023 | $279,700 | $152,100 | $127,600 |
| 2017 | $4,914 | $268,500 | $145,000 | $123,500 |
| 2016 | $4,831 | $266,000 | $145,000 | $121,000 |
| 2015 | $4,726 | $266,100 | $144,000 | $122,100 |
| 2014 | $4,605 | $265,100 | $141,000 | $124,100 |
Source: Public Records
Map
Nearby Homes