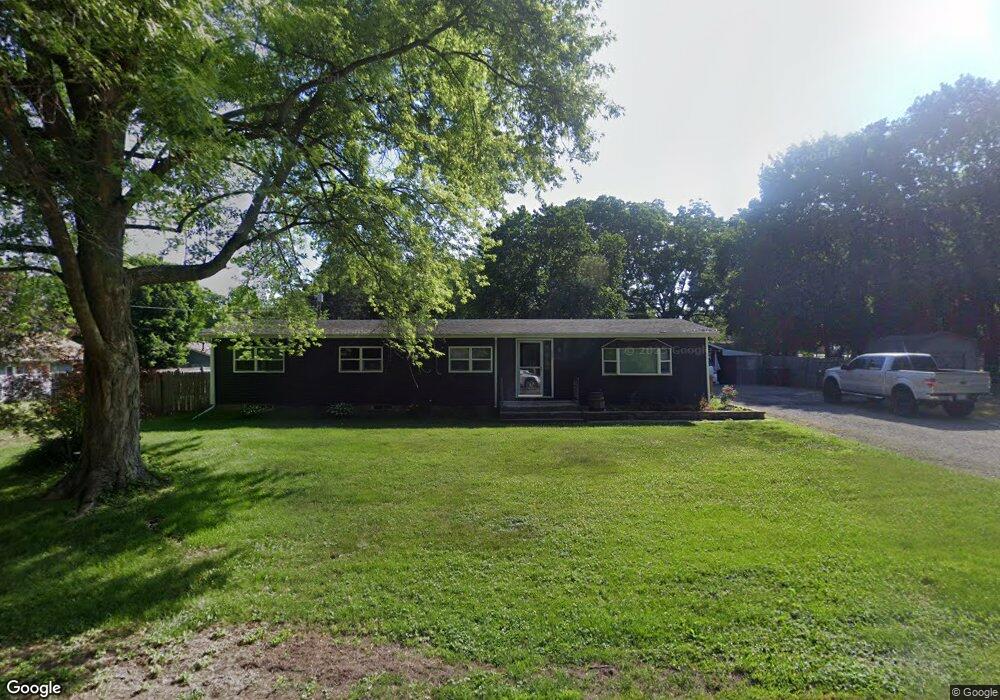
207 N Grant St Millington, IL 60537
Estimated Value: $282,630 - $308,000
3
Beds
2
Baths
1,440
Sq Ft
$204/Sq Ft
Est. Value
About This Home
This home is located at 207 N Grant St, Millington, IL 60537 and is currently estimated at $293,658, approximately $203 per square foot. 207 N Grant St is a home located in LaSalle County with nearby schools including Sandwich Community High School.
Ownership History
Date
Name
Owned For
Owner Type
Purchase Details
Closed on
Apr 15, 2005
Sold by
Wilkinson Carl E and Wilkinson Beatrice E
Bought by
Bundy Dawn M and Newberry Anthony
Current Estimated Value
Home Financials for this Owner
Home Financials are based on the most recent Mortgage that was taken out on this home.
Original Mortgage
$31,000
Interest Rate
6.05%
Mortgage Type
Seller Take Back
Create a Home Valuation Report for This Property
The Home Valuation Report is an in-depth analysis detailing your home's value as well as a comparison with similar homes in the area
Home Values in the Area
Average Home Value in this Area
Purchase History
| Date | Buyer | Sale Price | Title Company |
|---|---|---|---|
| Bundy Dawn M | $155,000 | Ticor Title Insurance Co |
Source: Public Records
Mortgage History
| Date | Status | Borrower | Loan Amount |
|---|---|---|---|
| Closed | Bundy Dawn M | $31,000 |
Source: Public Records
Tax History Compared to Growth
Tax History
| Year | Tax Paid | Tax Assessment Tax Assessment Total Assessment is a certain percentage of the fair market value that is determined by local assessors to be the total taxable value of land and additions on the property. | Land | Improvement |
|---|---|---|---|---|
| 2024 | $4,686 | $73,479 | $11,121 | $62,358 |
| 2023 | $5,053 | $69,033 | $10,448 | $58,585 |
| 2022 | $4,196 | $62,638 | $9,480 | $53,158 |
| 2021 | $3,986 | $58,682 | $8,881 | $49,801 |
| 2020 | $3,827 | $56,555 | $8,559 | $47,996 |
| 2019 | $3,765 | $54,348 | $8,225 | $46,123 |
| 2018 | $3,645 | $51,529 | $7,798 | $43,731 |
| 2017 | $3,464 | $48,362 | $8,102 | $40,260 |
| 2016 | $3,592 | $48,434 | $8,114 | $40,320 |
| 2015 | $3,787 | $50,015 | $8,379 | $41,636 |
| 2012 | -- | $51,043 | $8,551 | $42,492 |
Source: Public Records
Map
Nearby Homes
- 208 W Sycamore St
- 509 Fowler St
- 10386 Fox River Dr
- 4416 E 29th Rd
- 4322 E 2859th Rd
- 4452 E 2969th Rd
- 4456 E 2969th Rd
- 4455 E 2969th Rd
- 2989 N 4459th Rd
- 4460 N 4459th Rd
- 2961 N 4459th Rd
- 2967 N 4459th Rd
- 2965 N 4459th Rd
- 4462 E 2979th Rd
- 2853 N 4360th Rd
- 4484 E 2979th Rd
- 4475 E 2979th Rd
- 4477 E 2979th Rd
- 4470 E 2979th Rd
- 4474 E 2979th Rd