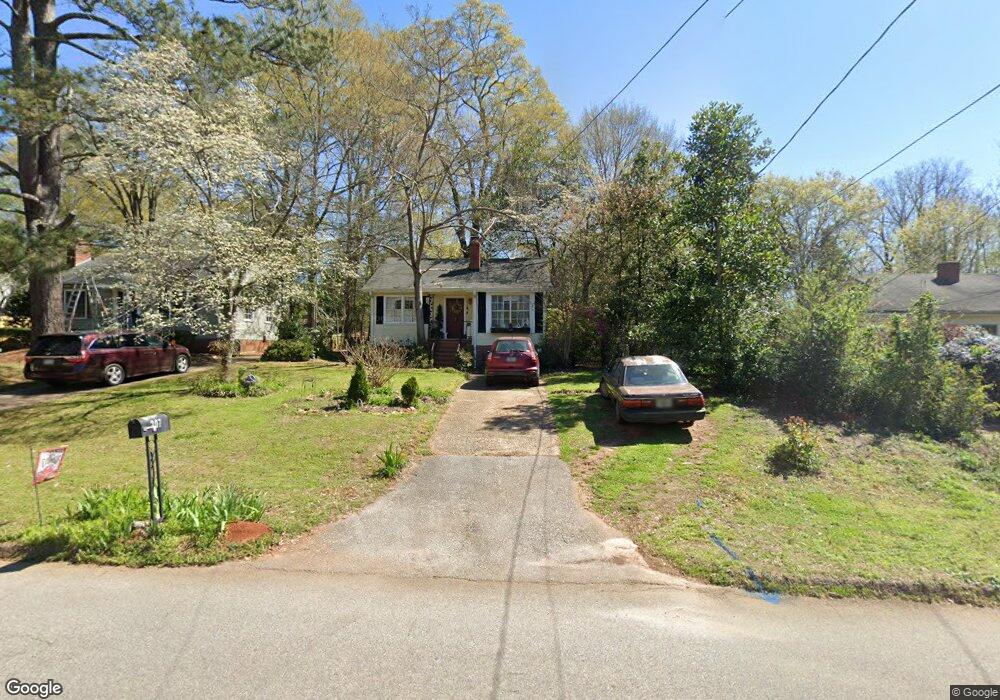
207 N Lee St Lagrange, GA 30240
Estimated Value: $156,419 - $204,000
3
Beds
2
Baths
1,735
Sq Ft
$105/Sq Ft
Est. Value
About This Home
This home is located at 207 N Lee St, Lagrange, GA 30240 and is currently estimated at $182,355, approximately $105 per square foot. 207 N Lee St is a home located in Troup County with nearby schools including Ethel W. Kight Elementary School, Hollis Hand Elementary School, and Franklin Forest Elementary School.
Ownership History
Date
Name
Owned For
Owner Type
Purchase Details
Closed on
Jul 15, 2002
Sold by
Neacie Robert N and Neacie Yarbrough
Bought by
Baker C Daniel
Current Estimated Value
Purchase Details
Closed on
Feb 14, 2001
Sold by
Richlan Properties Llc
Bought by
Neacie Robert N and Neacie Yarbrough
Purchase Details
Closed on
Oct 16, 2000
Sold by
Gweinner Marcus N
Bought by
Richlan Properties Llc
Purchase Details
Closed on
Oct 15, 2000
Sold by
Lagrange College
Bought by
Gweinner Marcus N
Purchase Details
Closed on
Apr 22, 1975
Sold by
Larry R Bishop?
Bought by
Lagrange College
Purchase Details
Closed on
Apr 19, 1975
Sold by
Mrs Ruth Higgins Case
Bought by
Larry R Bishop?
Purchase Details
Closed on
Jan 1, 1972
Sold by
Ruth E Higgins Etal
Bought by
Mrs Ruth Higgins Case
Purchase Details
Closed on
Sep 1, 1970
Sold by
Mason N Ashley
Bought by
Ruth E Higgins Etal
Create a Home Valuation Report for This Property
The Home Valuation Report is an in-depth analysis detailing your home's value as well as a comparison with similar homes in the area
Home Values in the Area
Average Home Value in this Area
Purchase History
| Date | Buyer | Sale Price | Title Company |
|---|---|---|---|
| Baker C Daniel | $118,000 | -- | |
| Neacie Robert N | $111,300 | -- | |
| Richlan Properties Llc | $52,500 | -- | |
| Gweinner Marcus N | -- | -- | |
| Lagrange College | $23,800 | -- | |
| Larry R Bishop? | -- | -- | |
| Mrs Ruth Higgins Case | -- | -- | |
| Ruth E Higgins Etal | -- | -- |
Source: Public Records
Tax History Compared to Growth
Tax History
| Year | Tax Paid | Tax Assessment Tax Assessment Total Assessment is a certain percentage of the fair market value that is determined by local assessors to be the total taxable value of land and additions on the property. | Land | Improvement |
|---|---|---|---|---|
| 2024 | $932 | $36,172 | $7,200 | $28,972 |
| 2023 | $855 | $33,336 | $7,200 | $26,136 |
| 2022 | $840 | $32,096 | $7,200 | $24,896 |
| 2021 | $863 | $30,604 | $7,200 | $23,404 |
| 2020 | $863 | $30,604 | $7,200 | $23,404 |
| 2019 | $800 | $28,528 | $7,200 | $21,328 |
| 2018 | $799 | $28,478 | $7,150 | $21,328 |
| 2017 | $799 | $28,478 | $7,150 | $21,328 |
| 2016 | $777 | $27,762 | $7,150 | $20,612 |
| 2015 | $782 | $27,848 | $7,236 | $20,612 |
| 2014 | $750 | $26,763 | $7,236 | $19,527 |
| 2013 | -- | $30,136 | $7,220 | $22,916 |
Source: Public Records
Map
Nearby Homes
- 0 N Lee St Unit 10550825
- 209 N Lee St
- 217 Jefferson St
- 211 Moores Hill
- 0 Moores Hill
- 507 S Lee St
- 107 Clark St
- 517 Jefferson St
- 102 Parker St
- 202 Parker Ln
- 610 Wilburn Ave
- 608 Wilburn Ave
- 612 S Lee St
- 109 Garfield St
- 208 Boulevard
- 110 Waverly Way
- 701 Jefferson St
- 209 Boulevard
- 203 Waverly Way
- 812 Elm St
- 203 N Lee St
- 201 N Lee St
- N N Lee St
- 208 Jefferson St
- 206 Jefferson St
- 214 Jefferson St
- 213 N Lee St
- 206 N Lee St
- 202 N Lee St
- 210 N Lee St
- 216 Jefferson St
- 202 Jefferson St
- 302 N Lee St
- 1211 Vernon St
- 305 N Lee St
- 1301 Vernon St
- 218 Jefferson St
- 218 Jefferson St
- 1305 A & B Vernon St
- 1305 Vernon St Unit B