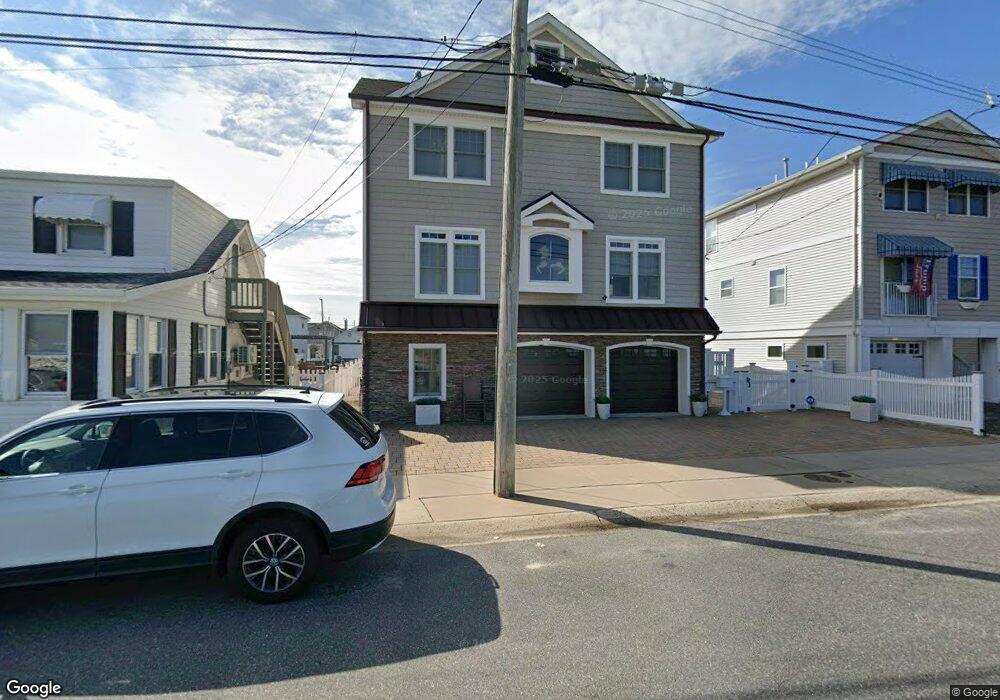
207 O St Unit 11 Seaside Park, NJ 08752
Estimated Value: $744,930
3
Beds
4
Baths
2,806
Sq Ft
$265/Sq Ft
Est. Value
About This Home
This home is located at 207 O St Unit 11, Seaside Park, NJ 08752 and is currently estimated at $744,930, approximately $265 per square foot. 207 O St Unit 11 is a home located in Ocean County with nearby schools including Central Regional Middle School and Central Regional High School.
Ownership History
Date
Name
Owned For
Owner Type
Purchase Details
Closed on
Jul 31, 2012
Sold by
Benninger Management Llc
Bought by
Benninger Richard A and Benninger Mary J
Current Estimated Value
Purchase Details
Closed on
Oct 20, 2005
Sold by
Benninger Richard A and Benninger Mary J
Bought by
Benninger Management Llc
Purchase Details
Closed on
Jul 25, 1997
Sold by
Bachmann Louis C and Bilquist Carol L
Bought by
Benninger Richard A and Benninger Mary J
Create a Home Valuation Report for This Property
The Home Valuation Report is an in-depth analysis detailing your home's value as well as a comparison with similar homes in the area
Home Values in the Area
Average Home Value in this Area
Purchase History
| Date | Buyer | Sale Price | Title Company |
|---|---|---|---|
| Benninger Richard A | $163,364 | None Available | |
| Benninger Management Llc | -- | Fidelity National Title Insu | |
| Benninger Richard A | $160,000 | Fidelity National Title Ins |
Source: Public Records
Tax History Compared to Growth
Tax History
| Year | Tax Paid | Tax Assessment Tax Assessment Total Assessment is a certain percentage of the fair market value that is determined by local assessors to be the total taxable value of land and additions on the property. | Land | Improvement |
|---|---|---|---|---|
| 2025 | -- | $711,100 | $450,000 | $261,100 |
| 2024 | -- | $711,100 | $450,000 | $261,100 |
| 2023 | -- | $711,100 | $450,000 | $261,100 |
| 2022 | $0 | $711,100 | $450,000 | $261,100 |
| 2021 | $8,651 | $711,100 | $450,000 | $261,100 |
| 2020 | $0 | $711,100 | $450,000 | $261,100 |
| 2019 | $8,651 | $630,800 | $450,000 | $180,800 |
| 2018 | $0 | $630,800 | $450,000 | $180,800 |
| 2017 | $8,651 | $630,800 | $450,000 | $180,800 |
| 2016 | $8,276 | $630,800 | $450,000 | $180,800 |
| 2015 | $8,935 | $652,700 | $540,000 | $112,700 |
| 2014 | $8,537 | $652,700 | $540,000 | $112,700 |
Source: Public Records
Map
Nearby Homes
- 139 N St
- 105 O St
- 121 L St
- 1409 NE Central Ave
- 111 K St Unit A2
- 70 K St
- 8 Bay Blvd Unit 1
- 235 Bay Terrace Unit A
- 235A Bay Terrace Unit A
- 30 N St
- 1614-1618 Ocean Blvd Unit 18
- 25 O St
- 66 I St
- 58 I St
- 3 E Central Ave
- 45-55 Dupont Ave
- 111 Dupont Ave
- 119 Dupont Ave Unit 10
- 1912 Boulevard
- 1 Boulevard Unit G