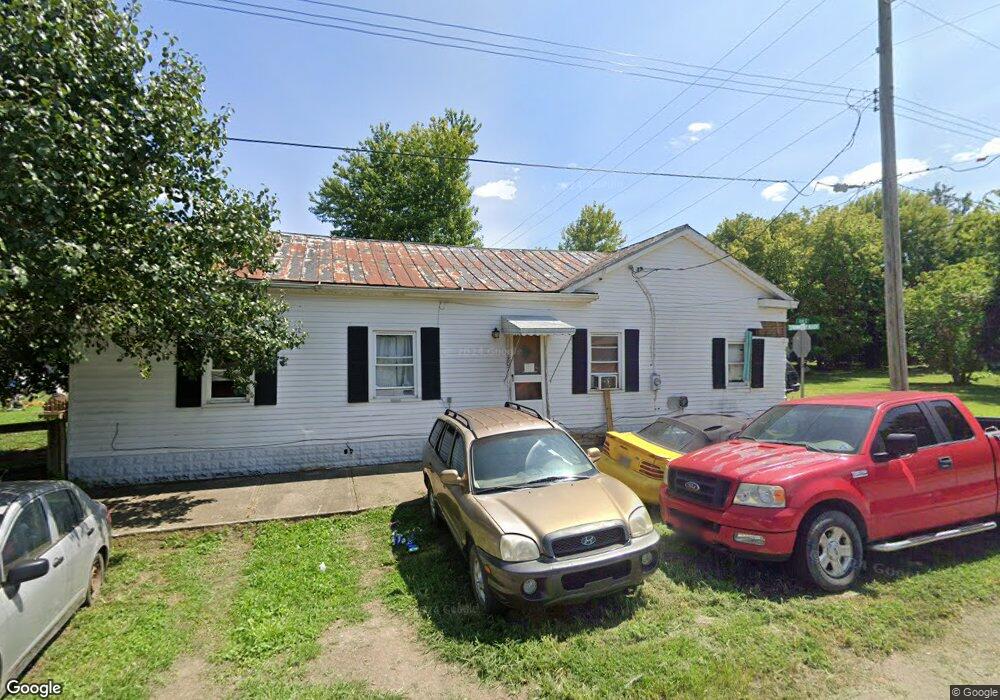
207 Olive St Higginsport, OH 45131
Estimated Value: $75,872 - $161,000
3
Beds
1
Bath
1,232
Sq Ft
$93/Sq Ft
Est. Value
About This Home
This home is located at 207 Olive St, Higginsport, OH 45131 and is currently estimated at $114,218, approximately $92 per square foot. 207 Olive St is a home located in Brown County with nearby schools including Ripley Union Lewis Huntington Elementary School, Ripley Union Lewis Huntington Middle School, and Ripley-Union-Lewis-Huntington High School.
Ownership History
Date
Name
Owned For
Owner Type
Purchase Details
Closed on
Dec 23, 2019
Sold by
Knechtly Larry and Knechtly Diana
Bought by
Jones Wayne and Jones Linda
Current Estimated Value
Purchase Details
Closed on
Aug 12, 2019
Sold by
Fields Chris
Bought by
Knechtly Larry and Knechtly Diana
Purchase Details
Closed on
Aug 19, 2011
Sold by
Eh Pooled 211 Lp Texas Lp
Bought by
Fields Chris
Purchase Details
Closed on
Aug 1, 2011
Sold by
Hsbc Bank Usa
Bought by
Eh Pooled 211 Lp
Purchase Details
Closed on
Dec 10, 2010
Sold by
Giar Sandra and Giar Sandra L
Bought by
Hsbc Bank Usa National Association
Purchase Details
Closed on
May 31, 2006
Sold by
Dunn David L and Dunn Karen R
Bought by
Giar Sandra
Home Financials for this Owner
Home Financials are based on the most recent Mortgage that was taken out on this home.
Original Mortgage
$75,000
Interest Rate
10.5%
Mortgage Type
Purchase Money Mortgage
Create a Home Valuation Report for This Property
The Home Valuation Report is an in-depth analysis detailing your home's value as well as a comparison with similar homes in the area
Home Values in the Area
Average Home Value in this Area
Purchase History
| Date | Buyer | Sale Price | Title Company |
|---|---|---|---|
| Jones Wayne | $15,000 | None Available | |
| Knechtly Larry | $14,000 | None Available | |
| Fields Chris | $18,405 | None Available | |
| Eh Pooled 211 Lp | $9,505 | None Available | |
| Hsbc Bank Usa National Association | $40,000 | Attorney | |
| Giar Sandra | $75,000 | Chase Legal Title Llc |
Source: Public Records
Mortgage History
| Date | Status | Borrower | Loan Amount |
|---|---|---|---|
| Previous Owner | Giar Sandra | $75,000 |
Source: Public Records
Tax History Compared to Growth
Tax History
| Year | Tax Paid | Tax Assessment Tax Assessment Total Assessment is a certain percentage of the fair market value that is determined by local assessors to be the total taxable value of land and additions on the property. | Land | Improvement |
|---|---|---|---|---|
| 2024 | $323 | $17,990 | $6,690 | $11,300 |
| 2023 | $308 | $20,830 | $5,410 | $15,420 |
| 2022 | $830 | $20,830 | $5,410 | $15,420 |
| 2021 | $823 | $20,830 | $5,410 | $15,420 |
| 2020 | $838 | $18,090 | $4,680 | $13,410 |
| 2019 | $8,107 | $18,090 | $4,680 | $13,410 |
| 2018 | $813 | $18,090 | $4,680 | $13,410 |
| 2017 | $854 | $18,550 | $5,150 | $13,400 |
| 2016 | $858 | $18,550 | $5,150 | $13,400 |
| 2015 | $765 | $18,550 | $5,150 | $13,400 |
| 2014 | -- | $18,080 | $4,680 | $13,400 |
| 2013 | $733 | $18,080 | $4,680 | $13,400 |
Source: Public Records
Map
Nearby Homes
- 312 White Oak St
- 2845 Mary Ingles Hwy E
- 6049 Big Run Rd
- 4900 Mary Ingles Hwy E
- 307 Hamilton Ave
- 508 E 3rd St
- 1920 Shinkles Ridge
- 4465 W Augusta Chatham Rd
- 414 E 2nd St
- 6336 Big Run Rd
- 404 E 2nd St
- 401 E 4th St
- 310 E 3rd St
- 305 Bracken St
- 207 E 3rd St
- Lot 49 Boudes Ferry Rd
- 301 Elizabeth St
- 114 E 4th St
- 105 E 4th St
- ac Shinkle Ridge Rd
- 101 Olive St
- 0 Columbia St Unit 1717578
- 0 Columbia St
- 200 Columbia St
- 202 Columbia St
- 117 Columbia St
- 106 Columbia St
- 203 Gaines St
- 204 Columbia St
- 200 Gaines St
- 104 Columbia St
- 205 Columbia St
- 105 Columbia St
- 207 Columbia St
- 205 Gaines St
- 312 Gaines St
- 214 Columbia St
- 210 Columbia St
- 210 Johnson St
- 105 John St