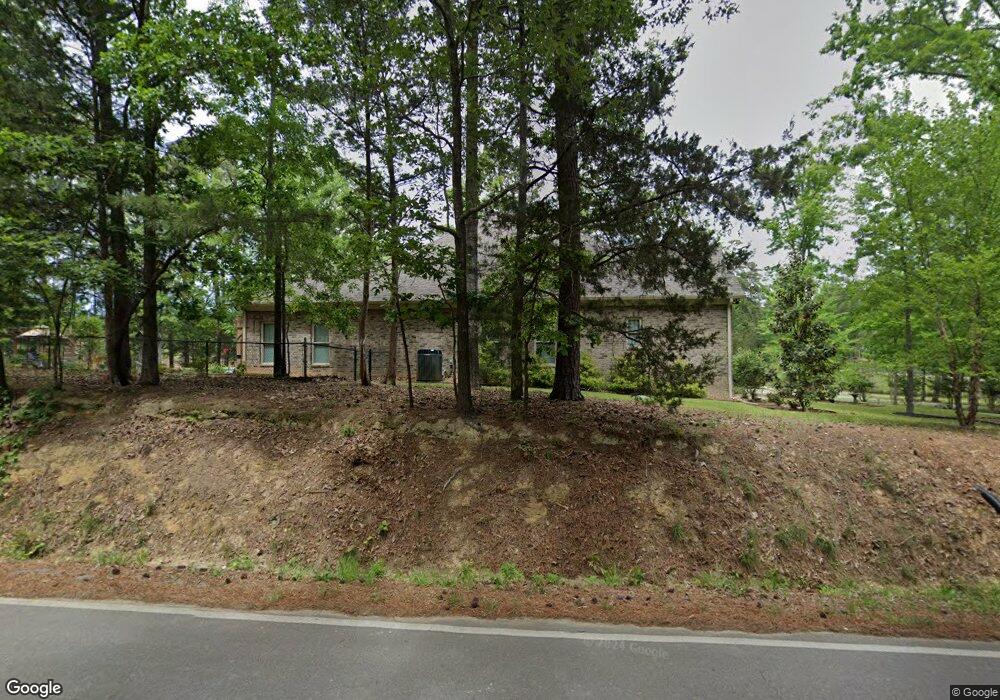
207 Pebble Branch Dr Chapin, SC 29036
Estimated Value: $406,000 - $697,000
4
Beds
4
Baths
2,764
Sq Ft
$193/Sq Ft
Est. Value
About This Home
This home is located at 207 Pebble Branch Dr, Chapin, SC 29036 and is currently estimated at $532,918, approximately $192 per square foot. 207 Pebble Branch Dr is a home located in Lexington County with nearby schools including Lake Murray Elementary School, Chapin Intermediate, and Chapin High School.
Ownership History
Date
Name
Owned For
Owner Type
Purchase Details
Closed on
Mar 4, 2022
Sold by
Lee Starling Robert
Bought by
Starling Robert Lee and Starling Linda Lee
Current Estimated Value
Purchase Details
Closed on
Jul 10, 2019
Sold by
Blake Carol and Iverson Paul
Bought by
Iverson Carol M and Iverson Paul J
Purchase Details
Closed on
Oct 9, 2012
Sold by
Starling Linda Lee and Starling Robert Lee
Bought by
Blake Carol and Iverson Paul
Home Financials for this Owner
Home Financials are based on the most recent Mortgage that was taken out on this home.
Original Mortgage
$20,000
Interest Rate
3.6%
Mortgage Type
Future Advance Clause Open End Mortgage
Purchase Details
Closed on
Feb 29, 2008
Sold by
Bass Kenneth Allison
Bought by
Starling Robert Lee and Starling Linda Lee
Purchase Details
Closed on
Dec 5, 2006
Sold by
Starling Robert Lee and Starling Linda Lee
Bought by
Bass Kenneth Allison
Create a Home Valuation Report for This Property
The Home Valuation Report is an in-depth analysis detailing your home's value as well as a comparison with similar homes in the area
Home Values in the Area
Average Home Value in this Area
Purchase History
| Date | Buyer | Sale Price | Title Company |
|---|---|---|---|
| Starling Robert Lee | -- | Law Office Of Smokey Brown Pc | |
| Starling Robert Lee | -- | None Listed On Document | |
| Iverson Carol M | -- | None Available | |
| Blake Carol | $30,000 | -- | |
| Starling Robert Lee | $50,809 | None Available | |
| Bass Kenneth Allison | $45,000 | None Available |
Source: Public Records
Mortgage History
| Date | Status | Borrower | Loan Amount |
|---|---|---|---|
| Previous Owner | Blake Carol | $20,000 |
Source: Public Records
Tax History
| Year | Tax Paid | Tax Assessment Tax Assessment Total Assessment is a certain percentage of the fair market value that is determined by local assessors to be the total taxable value of land and additions on the property. | Land | Improvement |
|---|---|---|---|---|
| 2024 | $2,058 | $12,497 | $1,960 | $10,537 |
| 2023 | $1,913 | $12,497 | $1,960 | $10,537 |
| 2020 | $2,021 | $12,497 | $1,960 | $10,537 |
| 2019 | $1,697 | $10,317 | $1,156 | $9,161 |
| 2018 | $1,494 | $10,317 | $1,156 | $9,161 |
| 2017 | $1,456 | $10,317 | $1,156 | $9,161 |
| 2016 | $704 | $1,734 | $1,734 | $0 |
| 2014 | $702 | $1,800 | $1,800 | $0 |
| 2013 | -- | $1,800 | $1,800 | $0 |
Source: Public Records
Map
Nearby Homes
- 345 Rising Stream Way
- 407 Rising Stream Way
- 426 Rising Stream Way
- 414 Rising Stream Way
- 410 Rising Stream Way
- 419 Rising Stream Way
- 427 Rising Stream Way
- 613 Falling Leaf Ln
- 617 Falling Leaf Ln
- 734 Autumn Shiloh Dr
- 932 Trident Maple Ln
- 2411 Old Lexington Hwy
- 622 Autumn Shiloh Dr
- 623 Autumn Shiloh Dr
- 516 Mitscher Way
- 1304 Canopy Crest Ln
- 1615 Birch Grain Rd
- 533 Mitscher Way
- 603 Riverdale Ct
- 237 Timber Wood Dr
- 213 Pebble Branch Dr
- 201 Hill Haven Rd
- 0 State Road S-32-1089
- 214 Pebblebranch Dr
- 216 Hill Haven Rd
- 224 Hill Haven Rd
- 192 Pebble Branch Dr
- 117 Cobble Stone Ct
- 410 Pebblebranch Ct
- 0 Pebble Branch Dr Unit 289201
- 0 Pebble Branch Dr Unit 308766
- 239 Pebblebranch Dr
- 123 Cobble Stone Ct
- 184 Pebblebranch Dr
- 184 State Road S-32-1089
- 414 Pebblebranch Ct
- Lot B Pebblebranch Ct
- 232 Hill Haven Rd
- 125 Cobblestone Ct
- 233 Hill Haven Rd
Your Personal Tour Guide
Ask me questions while you tour the home.