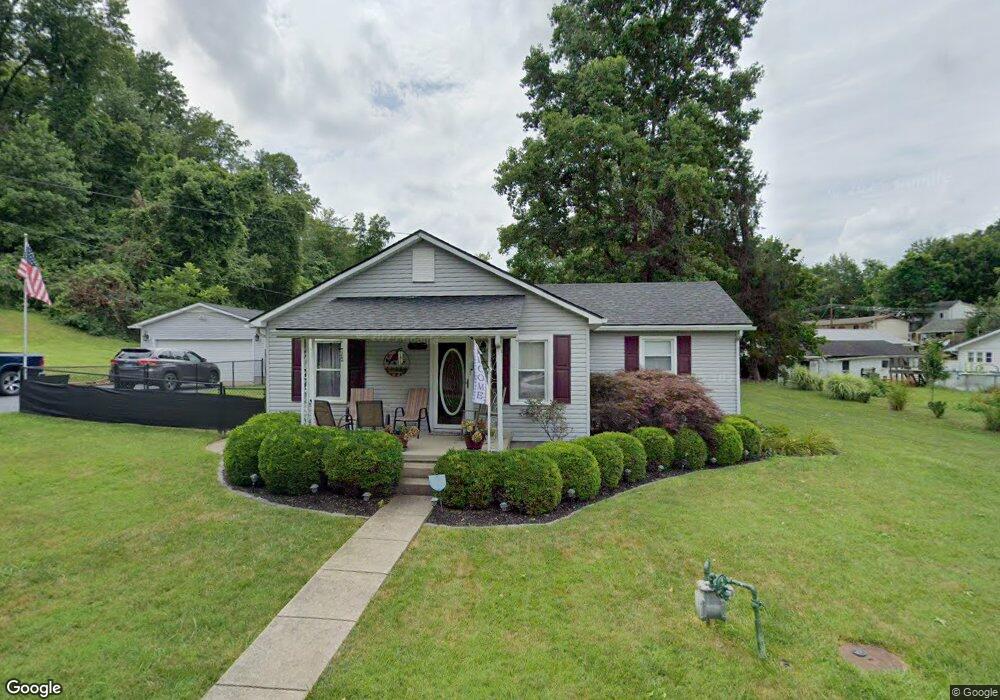
207 Powers St Grayson, KY 41143
Estimated Value: $93,000 - $177,000
3
Beds
2
Baths
1,020
Sq Ft
$131/Sq Ft
Est. Value
About This Home
This home is located at 207 Powers St, Grayson, KY 41143 and is currently estimated at $133,906, approximately $131 per square foot. 207 Powers St is a home located in Carter County with nearby schools including Prichard Elementary School, East Carter Middle School, and East Carter County High School.
Ownership History
Date
Name
Owned For
Owner Type
Purchase Details
Closed on
Oct 24, 2023
Sold by
Maple Mill Properties Llc
Bought by
Meadows Carl R
Current Estimated Value
Purchase Details
Closed on
Feb 29, 2008
Home Financials for this Owner
Home Financials are based on the most recent Mortgage that was taken out on this home.
Original Mortgage
$85,163
Interest Rate
5.63%
Mortgage Type
FHA
Create a Home Valuation Report for This Property
The Home Valuation Report is an in-depth analysis detailing your home's value as well as a comparison with similar homes in the area
Home Values in the Area
Average Home Value in this Area
Purchase History
| Date | Buyer | Sale Price | Title Company |
|---|---|---|---|
| Meadows Carl R | $23,000 | None Listed On Document | |
| -- | $86,500 | None Available |
Source: Public Records
Mortgage History
| Date | Status | Borrower | Loan Amount |
|---|---|---|---|
| Previous Owner | -- | $85,163 |
Source: Public Records
Tax History
| Year | Tax Paid | Tax Assessment Tax Assessment Total Assessment is a certain percentage of the fair market value that is determined by local assessors to be the total taxable value of land and additions on the property. | Land | Improvement |
|---|---|---|---|---|
| 2025 | $738 | $86,500 | $0 | $0 |
| 2024 | $742 | $86,500 | $0 | $0 |
| 2023 | $746 | $86,500 | $0 | $0 |
| 2022 | $748 | $86,500 | $0 | $0 |
| 2021 | $763 | $86,500 | $0 | $0 |
| 2020 | $765 | $86,500 | $10,000 | $76,500 |
| 2019 | $763 | $86,500 | $10,000 | $76,500 |
| 2018 | $763 | $86,500 | $10,000 | $76,500 |
| 2017 | $728 | $86,500 | $10,000 | $76,500 |
| 2016 | $727 | $86,500 | $10,000 | $76,500 |
| 2015 | $709 | $86,500 | $10,000 | $76,500 |
| 2014 | $709 | $86,500 | $10,000 | $76,500 |
| 2011 | $697 | $86,500 | $10,000 | $76,500 |
Source: Public Records
Map
Nearby Homes
- 610 Holcomb St
- 114 Embassy Dr
- 119 Embassy Dr
- 830 Old Town Branch Rd
- 103 Bluegrass Way
- 312 N Court St
- 000 Belair Land
- 211 College Hill Dr
- 5 S Carol Malone Blvd
- 0 Lakepoint Dr
- 0 Promise Land Dr
- 807 Kibbey St
- 65 7th St
- 710 Elm St
- 711 Circle Dr
- 105 Bluegrass
- 172 Condominium Dr
- 3.95 acres Plantation Dr
- 817 Cherrywood Ln
- 100 Driftwood Ln
- 516 Lynnwood Dr
- 514 Lynnwood Dr
- 605 Holcomb St
- 601 Holcomb St
- 515 Holcomb St
- 609 Holcomb St
- 512 Lynnwood Dr
- 608 Holcomb St
- 513 Holcomb St
- 611 Holcomb St
- 606 Holcomb St
- 602 Holcomb St
- 509 Lynnwood Dr
- 612 Holcomb St
- 510 Lynnwood Dr
- 613 Holcomb St
- 511 Holcomb St
- 605 Town Branch Rd
- 516 Holcomb St
- 517 Lynnwood Dr
Your Personal Tour Guide
Ask me questions while you tour the home.