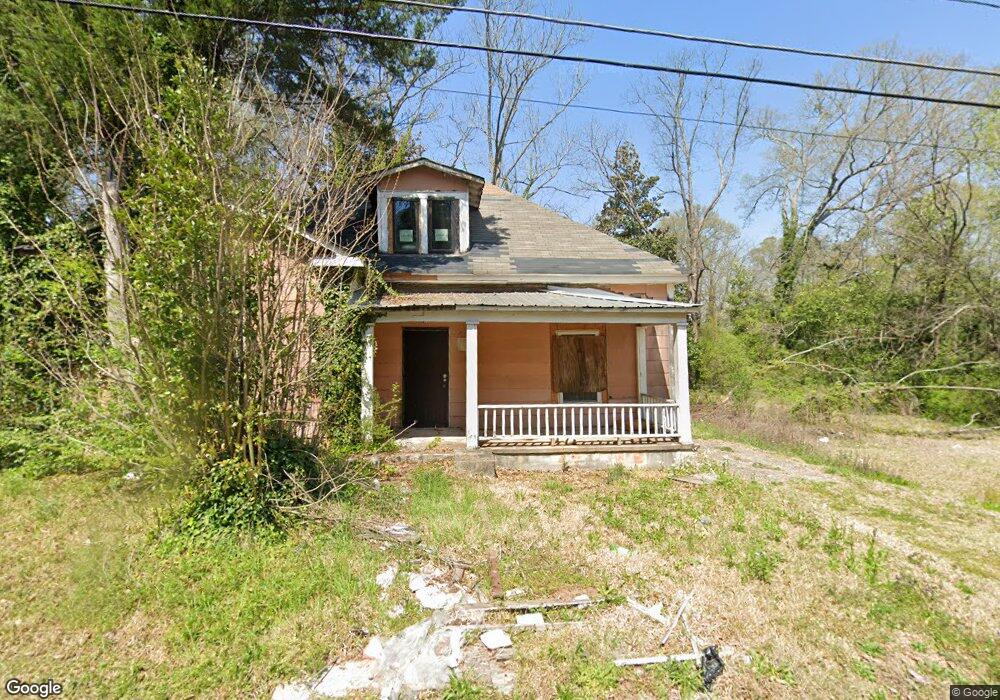
207 Revis St Lagrange, GA 30241
Estimated Value: $49,000 - $85,000
2
Beds
1
Bath
1,466
Sq Ft
$48/Sq Ft
Est. Value
About This Home
This home is located at 207 Revis St, Lagrange, GA 30241 and is currently estimated at $69,933, approximately $47 per square foot. 207 Revis St is a home located in Troup County with nearby schools including Hollis Hand Elementary School, Franklin Forest Elementary School, and Ethel W. Kight Elementary School.
Ownership History
Date
Name
Owned For
Owner Type
Purchase Details
Closed on
Jun 3, 2024
Sold by
Hill Regina
Bought by
Sivell Adrin
Current Estimated Value
Purchase Details
Closed on
Mar 26, 2024
Sold by
Sivell Mary A
Bought by
Hill Regina
Purchase Details
Closed on
Mar 17, 2016
Sold by
David Bradley Rentals Llc
Bought by
Sivell Mary A
Purchase Details
Closed on
Jan 20, 1993
Sold by
Commercial Bank & Trust Co
Bought by
Perry David Bradley
Purchase Details
Closed on
Jan 5, 1993
Sold by
Commercial Bank & Trust Co
Bought by
Commercial Bank & Trust Co
Purchase Details
Closed on
Aug 7, 1989
Sold by
Crowe James Barry Interest
Bought by
Commercial Bank & Trust Co
Purchase Details
Closed on
Apr 7, 1989
Sold by
Thompson E Lavaughn
Bought by
Crowe James Barry Interest
Purchase Details
Closed on
Mar 15, 1989
Sold by
Warner C E
Bought by
Thompson E Lavaughn
Purchase Details
Closed on
May 1, 1941
Sold by
Warner C E
Bought by
Warner C E
Create a Home Valuation Report for This Property
The Home Valuation Report is an in-depth analysis detailing your home's value as well as a comparison with similar homes in the area
Purchase History
| Date | Buyer | Sale Price | Title Company |
|---|---|---|---|
| Sivell Adrin | -- | -- | |
| Hill Regina | -- | -- | |
| Sivell Mary A | $5,060 | -- | |
| Perry David Bradley | $25,500 | -- | |
| Commercial Bank & Trust Co | $8,700 | -- | |
| Commercial Bank & Trust Co | -- | -- | |
| Crowe James Barry Interest | $6,500 | -- | |
| Thompson E Lavaughn | $2,700 | -- | |
| Warner C E | -- | -- |
Source: Public Records
Tax History
| Year | Tax Paid | Tax Assessment Tax Assessment Total Assessment is a certain percentage of the fair market value that is determined by local assessors to be the total taxable value of land and additions on the property. | Land | Improvement |
|---|---|---|---|---|
| 2025 | $184 | $6,760 | $2,200 | $4,560 |
| 2024 | $173 | $6,360 | $2,200 | $4,160 |
| 2023 | $145 | $5,320 | $2,200 | $3,120 |
| 2022 | $142 | $5,080 | $2,200 | $2,880 |
| 2021 | $180 | $5,960 | $2,200 | $3,760 |
| 2020 | $180 | $5,960 | $2,200 | $3,760 |
| 2019 | $165 | $5,480 | $2,200 | $3,280 |
| 2018 | $165 | $5,480 | $2,200 | $3,280 |
| 2017 | $61 | $5,480 | $2,200 | $3,280 |
| 2016 | $351 | $11,644 | $2,200 | $9,444 |
| 2015 | $352 | $11,644 | $2,200 | $9,444 |
| 2014 | $337 | $11,148 | $2,200 | $8,948 |
| 2013 | -- | $13,066 | $2,200 | $10,866 |
Source: Public Records
Map
Nearby Homes
Your Personal Tour Guide
Ask me questions while you tour the home.