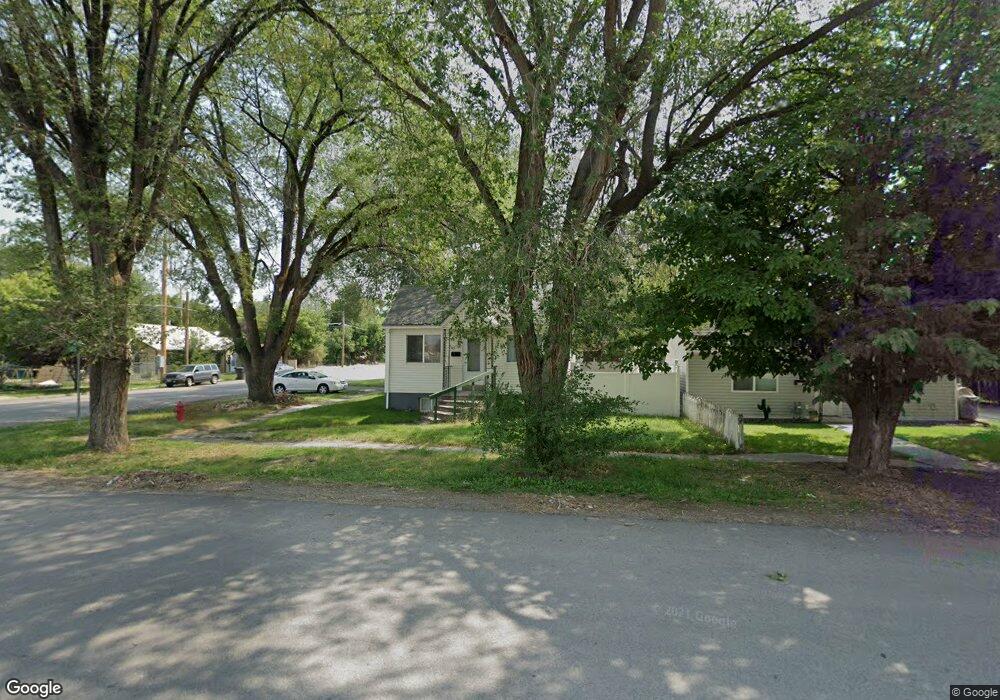
207 S 200 W Tremonton, UT 84337
Estimated Value: $273,866 - $320,000
3
Beds
1
Bath
1,534
Sq Ft
$189/Sq Ft
Est. Value
About This Home
This home is located at 207 S 200 W, Tremonton, UT 84337 and is currently estimated at $289,467, approximately $188 per square foot. 207 S 200 W is a home located in Box Elder County with nearby schools including McKinley School, Alice C. Harris Intermediate School, and Bear River Middle School.
Ownership History
Date
Name
Owned For
Owner Type
Purchase Details
Closed on
Jun 7, 2010
Sold by
Federal National Mortgage Association
Bought by
Jackson Juan
Current Estimated Value
Home Financials for this Owner
Home Financials are based on the most recent Mortgage that was taken out on this home.
Original Mortgage
$92,602
Outstanding Balance
$62,908
Interest Rate
5.25%
Mortgage Type
FHA
Estimated Equity
$226,559
Purchase Details
Closed on
Jan 27, 2010
Sold by
Barton David Bert
Bought by
Federal National Mortgage Association
Purchase Details
Closed on
Aug 2, 2007
Sold by
Homesales Inc
Bought by
Barton David Bert
Home Financials for this Owner
Home Financials are based on the most recent Mortgage that was taken out on this home.
Original Mortgage
$82,000
Interest Rate
6.66%
Mortgage Type
New Conventional
Purchase Details
Closed on
Apr 19, 2007
Sold by
Gonzales Ellie
Bought by
Favor Of Homesales Inc
Create a Home Valuation Report for This Property
The Home Valuation Report is an in-depth analysis detailing your home's value as well as a comparison with similar homes in the area
Home Values in the Area
Average Home Value in this Area
Purchase History
| Date | Buyer | Sale Price | Title Company |
|---|---|---|---|
| Jackson Juan | $93,850 | -- | |
| Federal National Mortgage Association | -- | -- | |
| Barton David Bert | -- | None Available | |
| Favor Of Homesales Inc | -- | None Available |
Source: Public Records
Mortgage History
| Date | Status | Borrower | Loan Amount |
|---|---|---|---|
| Open | Jackson Juan | $92,602 | |
| Previous Owner | Barton David Bert | $82,000 |
Source: Public Records
Tax History Compared to Growth
Tax History
| Year | Tax Paid | Tax Assessment Tax Assessment Total Assessment is a certain percentage of the fair market value that is determined by local assessors to be the total taxable value of land and additions on the property. | Land | Improvement |
|---|---|---|---|---|
| 2025 | $1,613 | $276,359 | $105,000 | $171,359 |
| 2024 | $1,613 | $273,593 | $105,000 | $168,593 |
| 2023 | $1,620 | $269,904 | $100,000 | $169,904 |
| 2022 | $1,384 | $131,418 | $16,500 | $114,918 |
| 2021 | $1,068 | $135,313 | $30,000 | $105,313 |
| 2020 | $895 | $135,313 | $30,000 | $105,313 |
| 2019 | $840 | $67,758 | $16,500 | $51,258 |
| 2018 | $624 | $46,797 | $13,750 | $33,047 |
| 2017 | $655 | $85,086 | $13,750 | $60,086 |
| 2016 | $647 | $45,223 | $13,750 | $31,473 |
| 2015 | $599 | $42,362 | $13,750 | $28,612 |
| 2014 | $599 | $41,000 | $13,750 | $27,250 |
| 2013 | -- | $40,588 | $13,338 | $27,250 |
Source: Public Records
Map
Nearby Homes