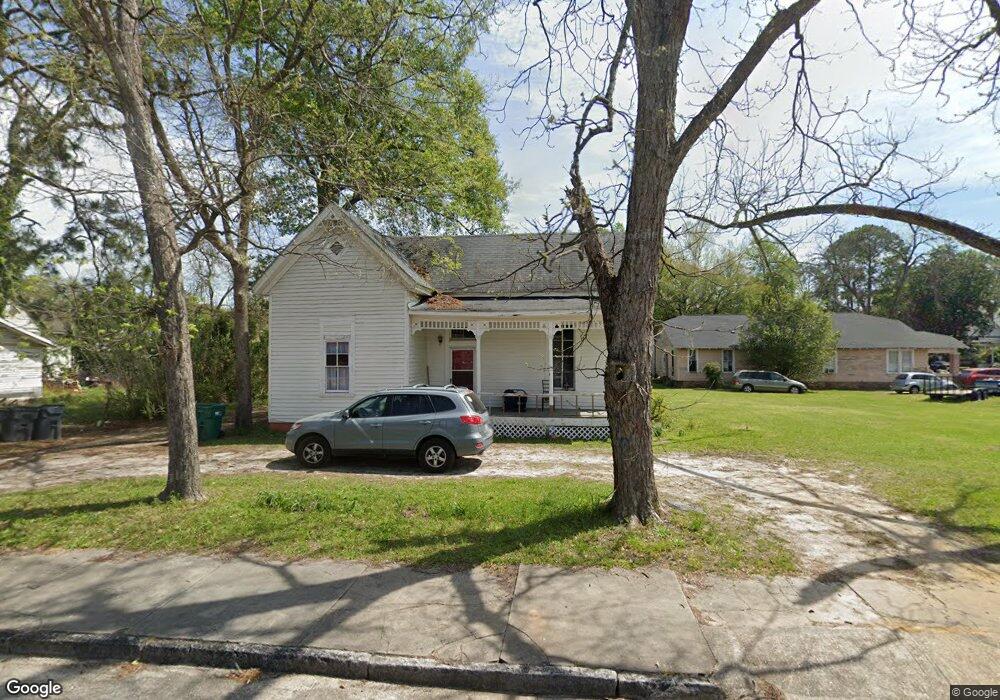
207 S 4th St Cordele, GA 31015
Estimated Value: $66,503 - $90,000
2
Beds
1
Bath
1,250
Sq Ft
$64/Sq Ft
Est. Value
About This Home
This home is located at 207 S 4th St, Cordele, GA 31015 and is currently estimated at $80,126, approximately $64 per square foot. 207 S 4th St is a home located in Crisp County with nearby schools including Crisp County Elementary School, Crisp County Primary School, and Crisp County Middle School.
Ownership History
Date
Name
Owned For
Owner Type
Purchase Details
Closed on
Jun 21, 2019
Sold by
Art Works Llc
Bought by
Jordan Samantha Marie
Current Estimated Value
Home Financials for this Owner
Home Financials are based on the most recent Mortgage that was taken out on this home.
Original Mortgage
$13,600
Interest Rate
4%
Mortgage Type
Commercial
Purchase Details
Closed on
Dec 20, 2006
Sold by
Irish Hugh R
Bought by
Art Works Llc
Home Financials for this Owner
Home Financials are based on the most recent Mortgage that was taken out on this home.
Original Mortgage
$40,000
Interest Rate
6.1%
Mortgage Type
New Conventional
Purchase Details
Closed on
Feb 5, 1997
Sold by
Rikard Denver A
Bought by
Irish Hugh R and Irish Lena
Purchase Details
Closed on
Apr 5, 1985
Bought by
Irish Hugh and Irish Lena
Purchase Details
Closed on
Sep 29, 1978
Bought by
Rickard Denver A
Create a Home Valuation Report for This Property
The Home Valuation Report is an in-depth analysis detailing your home's value as well as a comparison with similar homes in the area
Home Values in the Area
Average Home Value in this Area
Purchase History
| Date | Buyer | Sale Price | Title Company |
|---|---|---|---|
| Jordan Samantha Marie | $17,000 | -- | |
| Art Works Llc | $25,000 | -- | |
| Irish Hugh R | -- | -- | |
| Irish Hugh | $17,000 | -- | |
| Rickard Denver A | $4,100 | -- |
Source: Public Records
Mortgage History
| Date | Status | Borrower | Loan Amount |
|---|---|---|---|
| Closed | Jordan Samantha Marie | $13,600 | |
| Previous Owner | Art Works Llc | $40,000 |
Source: Public Records
Tax History Compared to Growth
Tax History
| Year | Tax Paid | Tax Assessment Tax Assessment Total Assessment is a certain percentage of the fair market value that is determined by local assessors to be the total taxable value of land and additions on the property. | Land | Improvement |
|---|---|---|---|---|
| 2025 | $1,045 | $31,860 | $1,250 | $30,610 |
| 2024 | $1,045 | $29,156 | $1,250 | $27,906 |
| 2023 | $1,042 | $27,804 | $1,250 | $26,554 |
| 2022 | $699 | $26,452 | $1,250 | $25,202 |
| 2021 | $685 | $25,100 | $1,250 | $23,850 |
| 2020 | $191 | $25,100 | $1,250 | $23,850 |
| 2019 | $712 | $25,100 | $1,250 | $23,850 |
| 2018 | $237 | $8,042 | $1,250 | $6,792 |
| 2017 | $308 | $7,594 | $1,250 | $6,344 |
| 2016 | $225 | $7,594 | $1,250 | $6,344 |
| 2015 | -- | $7,594 | $1,250 | $6,344 |
| 2014 | -- | $7,594 | $1,250 | $6,344 |
| 2013 | -- | $7,593 | $1,250 | $6,343 |
Source: Public Records
Map
Nearby Homes