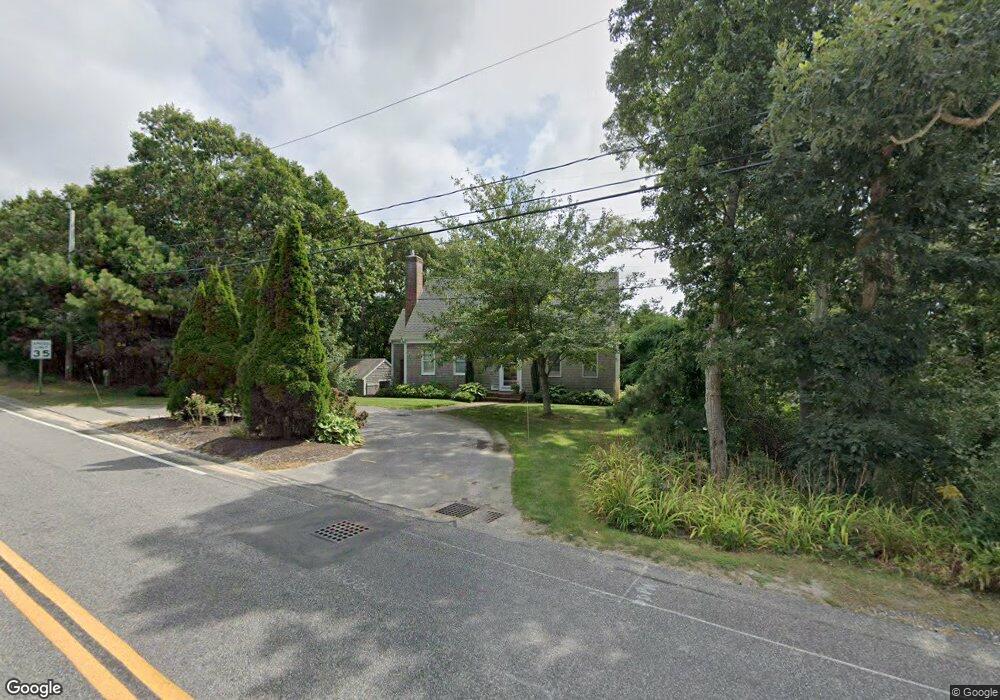
207 Setucket Rd South Dennis, MA 02660
South Dennis NeighborhoodEstimated Value: $647,000 - $803,000
3
Beds
3
Baths
1,801
Sq Ft
$416/Sq Ft
Est. Value
About This Home
This home is located at 207 Setucket Rd, South Dennis, MA 02660 and is currently estimated at $748,672, approximately $415 per square foot. 207 Setucket Rd is a home located in Barnstable County with nearby schools including Dennis-Yarmouth Regional High School.
Ownership History
Date
Name
Owned For
Owner Type
Purchase Details
Closed on
Jun 5, 2012
Sold by
Clancy Ret and Clancy
Bought by
Clancy Kathleen and Clancy Mark A
Current Estimated Value
Purchase Details
Closed on
Apr 18, 2012
Sold by
Clancy Mark and Clancy Kathleen A
Bought by
Clancy Ret and Clancy
Purchase Details
Closed on
Feb 29, 2000
Sold by
Clancy Keith and Clancy Laura
Bought by
Clancy Mark and Clancy Kathleena
Home Financials for this Owner
Home Financials are based on the most recent Mortgage that was taken out on this home.
Original Mortgage
$136,000
Interest Rate
8.15%
Mortgage Type
Purchase Money Mortgage
Purchase Details
Closed on
Apr 13, 1999
Sold by
Vallantini Thomas
Bought by
Mack Co Llc
Create a Home Valuation Report for This Property
The Home Valuation Report is an in-depth analysis detailing your home's value as well as a comparison with similar homes in the area
Home Values in the Area
Average Home Value in this Area
Purchase History
| Date | Buyer | Sale Price | Title Company |
|---|---|---|---|
| Clancy Kathleen | -- | -- | |
| Clancy Ret | -- | -- | |
| Clancy Mark | $170,000 | -- | |
| Mack Co Llc | $32,500 | -- |
Source: Public Records
Mortgage History
| Date | Status | Borrower | Loan Amount |
|---|---|---|---|
| Previous Owner | Clancy Mark | $136,000 |
Source: Public Records
Tax History
| Year | Tax Paid | Tax Assessment Tax Assessment Total Assessment is a certain percentage of the fair market value that is determined by local assessors to be the total taxable value of land and additions on the property. | Land | Improvement |
|---|---|---|---|---|
| 2025 | $3,201 | $739,300 | $148,800 | $590,500 |
| 2024 | $3,146 | $716,600 | $143,100 | $573,500 |
| 2023 | $3,077 | $658,900 | $130,100 | $528,800 |
| 2022 | $2,952 | $527,100 | $130,200 | $396,900 |
| 2021 | $4,438 | $450,700 | $127,700 | $323,000 |
| 2020 | $2,594 | $425,200 | $127,700 | $297,500 |
| 2019 | $2,538 | $411,300 | $137,700 | $273,600 |
| 2018 | $4,265 | $384,200 | $119,200 | $265,000 |
| 2017 | $2,363 | $384,200 | $119,200 | $265,000 |
| 2016 | $2,310 | $353,700 | $125,100 | $228,600 |
| 2015 | $2,264 | $353,700 | $125,100 | $228,600 |
| 2014 | $2,177 | $342,800 | $107,200 | $235,600 |
Source: Public Records
Map
Nearby Homes
- 32 Captain Walsh Dr
- 16 Hazelwood Rd
- 52 Uncle Bobs Way
- 71 Grassy Pond Dr
- 10 Uncle Bills Way
- 18 Asack Dr
- 39 Whittier Dr
- 14 S Yarmouth Rd
- 26 S West Dr
- 1 Charing Cross Rd
- 61 Terrace Hill Dr
- 58 Terrace Hill Dr
- 59 Main St Unit 7-3
- 59 Main St Unit 19-2
- 59 Route 6a Unit 9-2
- 59 Route 6a Unit 7-3
- 7 Vinland Dr
- 17 Fairmount Rd
- 111 Merchant Ave
- 17 Fairmount Rd
Your Personal Tour Guide
Ask me questions while you tour the home.