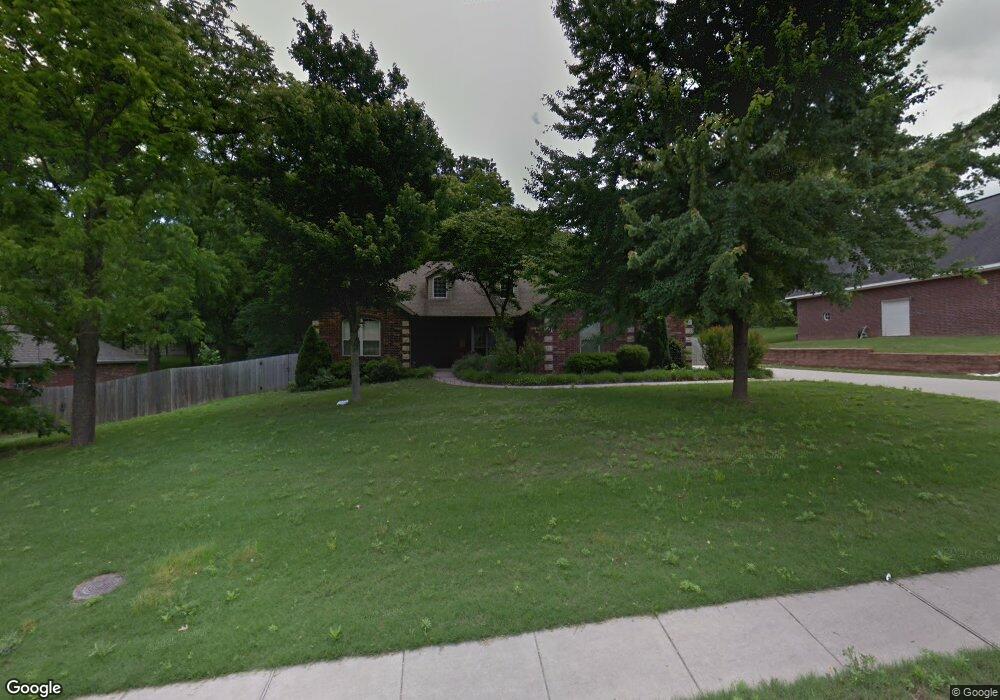
207 SW Tunbridge Dr Bentonville, AR 72712
Estimated Value: $318,000 - $460,000
--
Bed
2
Baths
1,388
Sq Ft
$291/Sq Ft
Est. Value
About This Home
This home is located at 207 SW Tunbridge Dr, Bentonville, AR 72712 and is currently estimated at $404,098, approximately $291 per square foot. 207 SW Tunbridge Dr is a home located in Benton County with nearby schools including R.E. Baker Elementary School, Ardis Ann Middle School, and Lincoln Junior High School.
Ownership History
Date
Name
Owned For
Owner Type
Purchase Details
Closed on
Jan 21, 2015
Sold by
Sutliff Sara and Sutliff Joseph
Bought by
Minden Sara
Current Estimated Value
Purchase Details
Closed on
Jul 26, 2013
Sold by
Roberts Timothy H and Roberts Leslie D
Bought by
Sutliff Joseph and Sutliff Sara
Home Financials for this Owner
Home Financials are based on the most recent Mortgage that was taken out on this home.
Original Mortgage
$214,515
Outstanding Balance
$159,187
Interest Rate
4.49%
Mortgage Type
VA
Estimated Equity
$244,911
Purchase Details
Closed on
Jul 1, 2002
Bought by
Roberts
Purchase Details
Closed on
Jan 19, 1999
Bought by
Crews Assoc
Purchase Details
Closed on
Nov 17, 1998
Bought by
Sims
Purchase Details
Closed on
Sep 21, 1998
Bought by
Crews
Purchase Details
Closed on
Jun 21, 1997
Bought by
Clarksville
Create a Home Valuation Report for This Property
The Home Valuation Report is an in-depth analysis detailing your home's value as well as a comparison with similar homes in the area
Home Values in the Area
Average Home Value in this Area
Purchase History
| Date | Buyer | Sale Price | Title Company |
|---|---|---|---|
| Minden Sara | -- | Lenders Title Company | |
| Sutliff Joseph | $210,000 | Lenders Title Company | |
| Roberts | $35,000 | -- | |
| Crews Assoc | -- | -- | |
| Clarksville | -- | -- | |
| Sims | -- | -- | |
| Crews | -- | -- | |
| Clarksville | -- | -- | |
| Clarksville | -- | -- |
Source: Public Records
Mortgage History
| Date | Status | Borrower | Loan Amount |
|---|---|---|---|
| Open | Sutliff Joseph | $214,515 |
Source: Public Records
Tax History Compared to Growth
Tax History
| Year | Tax Paid | Tax Assessment Tax Assessment Total Assessment is a certain percentage of the fair market value that is determined by local assessors to be the total taxable value of land and additions on the property. | Land | Improvement |
|---|---|---|---|---|
| 2025 | $2,413 | $68,206 | $24,000 | $44,206 |
| 2024 | $2,314 | $68,206 | $24,000 | $44,206 |
| 2023 | $2,204 | $42,950 | $11,400 | $31,550 |
| 2022 | $1,785 | $42,950 | $11,400 | $31,550 |
| 2021 | $1,680 | $42,950 | $11,400 | $31,550 |
| 2020 | $1,601 | $31,280 | $6,200 | $25,080 |
| 2019 | $1,524 | $31,280 | $6,200 | $25,080 |
| 2018 | $1,472 | $31,280 | $6,200 | $25,080 |
| 2017 | $1,265 | $31,280 | $6,200 | $25,080 |
| 2016 | $1,265 | $31,280 | $6,200 | $25,080 |
| 2015 | $1,501 | $24,290 | $7,300 | $16,990 |
| 2014 | $1,151 | $24,290 | $7,300 | $16,990 |
Source: Public Records
Map
Nearby Homes
- 206 SW Tunbridge Dr
- 101 Oakhurst St
- 2904 SW 2nd St
- 3102 SW Orchard Way
- 113 NW Orchard Way
- 3106 SW Orchard Way
- 214 El Contento Dr
- 3104 Mimosa Way
- 0 SW 2nd St
- 3100 NW Alberta
- 2703 SW 8th St
- 3202 Mimosa Way
- 301 SW Ramsey Ln
- 2605 NW 6th St
- 3631 Bitterroot Cove
- 700 SW Sterling Place
- 315 NW O St
- 0 NW Olinka Pass St
- 905 SW Apache Ct
- 411 NW Saddlebrook Dr
- 205 SW Tunbridge Dr
- 209 SW Tunbridge Dr
- 203 SW Tunbridge Dr
- 211 SW Tunbridge Dr
- 200 SW Tunbridge Dr
- 213 SW Tunbridge Dr
- 201 SW Tunbridge Dr
- 204 Tunbridge Dr
- 202 Tunbridge Dr
- 2503 SW 2nd St Unit Bld 2
- 306 Tunbridge Dr
- 208 SW Tunbridge Dr
- L23 Tunbridge Dr
- 4 Tunbridge Hills
- L44 Tunbridge (606 Sw Maidstone)
- L10 Tunbridge Subdivision
- 16 Tunbridge Wells L58
- L2 Tunbridge
- L24 Tunbridge Dr
- L10 Tunbridge Wells