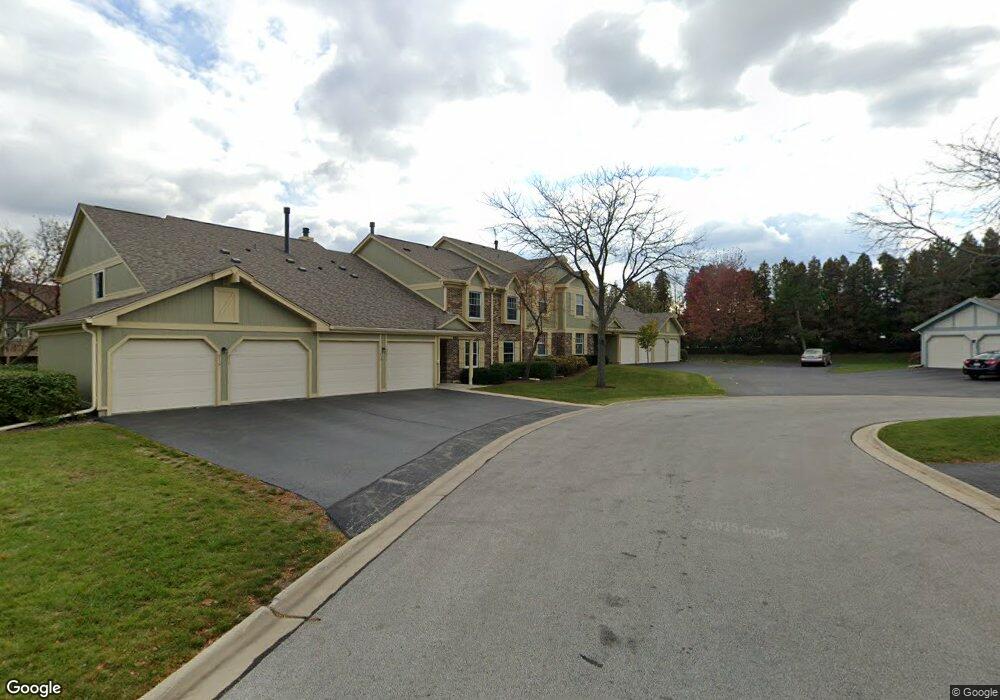
207 Thornapple Ct Buffalo Grove, IL 60089
Estimated Value: $275,000 - $299,000
--
Bed
2
Baths
1,034
Sq Ft
$275/Sq Ft
Est. Value
About This Home
This home is located at 207 Thornapple Ct, Buffalo Grove, IL 60089 and is currently estimated at $284,319, approximately $274 per square foot. 207 Thornapple Ct is a home located in Lake County with nearby schools including Ivy Hall Elementary School, Twin Groves Middle School, and Adlai E Stevenson High School.
Ownership History
Date
Name
Owned For
Owner Type
Purchase Details
Closed on
Apr 21, 2017
Sold by
Divita David A
Bought by
Hu Xiaolin
Current Estimated Value
Home Financials for this Owner
Home Financials are based on the most recent Mortgage that was taken out on this home.
Original Mortgage
$133,500
Outstanding Balance
$66,313
Interest Rate
3.12%
Mortgage Type
New Conventional
Estimated Equity
$218,006
Purchase Details
Closed on
Dec 8, 2016
Sold by
Divita David A and Young Debbie M
Bought by
Divita David A and The David A Divita Revocable Living Trus
Purchase Details
Closed on
Jun 16, 2016
Sold by
Greggo Annette E
Bought by
Divita David A and Young Debbie M
Home Financials for this Owner
Home Financials are based on the most recent Mortgage that was taken out on this home.
Original Mortgage
$125,000
Interest Rate
3.75%
Mortgage Type
New Conventional
Purchase Details
Closed on
Mar 15, 2013
Sold by
Greggo Annette
Bought by
Greggo Annette E and Annette E Greggo Living Trust
Create a Home Valuation Report for This Property
The Home Valuation Report is an in-depth analysis detailing your home's value as well as a comparison with similar homes in the area
Home Values in the Area
Average Home Value in this Area
Purchase History
| Date | Buyer | Sale Price | Title Company |
|---|---|---|---|
| Hu Xiaolin | $183,500 | Chicago Title | |
| Divita David A | -- | Attorney | |
| Divita David A | $175,000 | Attorneys Title Guaranty Fun | |
| Greggo Annette E | -- | None Available |
Source: Public Records
Mortgage History
| Date | Status | Borrower | Loan Amount |
|---|---|---|---|
| Open | Hu Xiaolin | $133,500 | |
| Previous Owner | Divita David A | $125,000 |
Source: Public Records
Tax History Compared to Growth
Tax History
| Year | Tax Paid | Tax Assessment Tax Assessment Total Assessment is a certain percentage of the fair market value that is determined by local assessors to be the total taxable value of land and additions on the property. | Land | Improvement |
|---|---|---|---|---|
| 2024 | $6,213 | $72,672 | $23,920 | $48,752 |
| 2023 | $5,969 | $68,571 | $22,570 | $46,001 |
| 2022 | $5,969 | $63,245 | $20,817 | $42,428 |
| 2021 | $5,739 | $62,564 | $20,593 | $41,971 |
| 2020 | $5,605 | $62,777 | $20,663 | $42,114 |
| 2019 | $5,531 | $62,546 | $20,587 | $41,959 |
| 2018 | $4,745 | $56,132 | $22,376 | $33,756 |
| 2017 | $4,651 | $54,822 | $21,854 | $32,968 |
| 2016 | $2,348 | $52,496 | $20,927 | $31,569 |
| 2015 | $2,453 | $49,094 | $19,571 | $29,523 |
| 2014 | $2,550 | $49,458 | $21,020 | $28,438 |
| 2012 | $2,414 | $49,557 | $21,062 | $28,495 |
Source: Public Records
Map
Nearby Homes
- 872 Old Checker Rd Unit E3
- 98 Stonegate Rd
- 746 Old Checker Rd Unit E5
- 4116 N Terramere Ave
- 329 Timber Hill Rd
- 921 Bernard Dr
- 1130 Bernard Dr
- 800 Clohesey Dr
- 408 Indian Hill Dr
- 1545 Chickamauga Ln
- 610 Checker Dr
- 811 W Nichols Rd
- 410 Chatham Cir
- 812 W Whiting Ln
- 715 W Whiting Ln
- 1514 Sumter Dr
- 412 Chateau Dr
- 887 Saybrook Ln Unit 2
- 1415 W Partridge Ln Unit 5
- 476 W Happfield Dr Unit 10AL
- 207 Thornapple Ct Unit 207
- 205 Thornapple Ct
- 205 Thornapple Ct Unit 1-11
- 211 Thornapple Ct
- 211 Thornapple Ct Unit 1-11-5
- 203 Thornapple Ct
- 201 Thornapple Ct
- 213 Thornapple Ct
- 215 Thornapple Ct
- 217 Thornapple Ct
- 1141 Auburn Ln
- 1143 Auburn Ln
- 1145 Auburn Ln
- 1137 Auburn Ln
- 1135 Auburn Ln
- 202 Thornapple Ct
- 1133 Auburn Ln
- 1131 Auburn Ln
- 204 Thornapple Ct Unit 204
- 206 Thornapple Ct