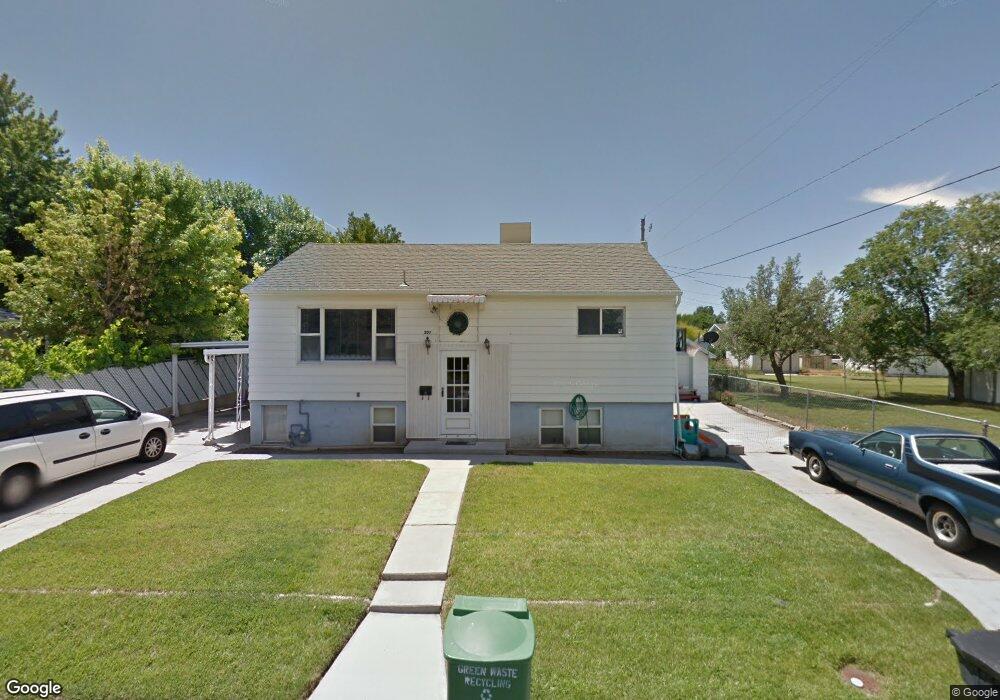
207 W 400 N Brigham City, UT 84302
Estimated Value: $344,406 - $377,000
4
Beds
2
Baths
2,014
Sq Ft
$180/Sq Ft
Est. Value
About This Home
This home is located at 207 W 400 N, Brigham City, UT 84302 and is currently estimated at $362,602, approximately $180 per square foot. 207 W 400 N is a home located in Box Elder County with nearby schools including Discovery School, Box Elder Middle School, and Adele C. Young Intermediate School.
Ownership History
Date
Name
Owned For
Owner Type
Purchase Details
Closed on
Sep 16, 2022
Sold by
Reinhart Jennifer
Bought by
Reinhart Michael and Reinhart Jennifer
Current Estimated Value
Home Financials for this Owner
Home Financials are based on the most recent Mortgage that was taken out on this home.
Original Mortgage
$100,000
Outstanding Balance
$85,049
Interest Rate
4.55%
Mortgage Type
New Conventional
Estimated Equity
$277,553
Purchase Details
Closed on
Apr 20, 2005
Sold by
Crapse Jennifer S and Crapse Laurin M
Bought by
Reinhart Jennifer S and Crapse Laurn M
Create a Home Valuation Report for This Property
The Home Valuation Report is an in-depth analysis detailing your home's value as well as a comparison with similar homes in the area
Home Values in the Area
Average Home Value in this Area
Purchase History
| Date | Buyer | Sale Price | Title Company |
|---|---|---|---|
| Reinhart Michael | -- | -- | |
| Reinhart Michael | -- | None Listed On Document | |
| Reinhart Jennifer S | -- | None Available |
Source: Public Records
Mortgage History
| Date | Status | Borrower | Loan Amount |
|---|---|---|---|
| Open | Reinhart Michael | $100,000 | |
| Closed | Reinhart Michael | $100,000 |
Source: Public Records
Tax History Compared to Growth
Tax History
| Year | Tax Paid | Tax Assessment Tax Assessment Total Assessment is a certain percentage of the fair market value that is determined by local assessors to be the total taxable value of land and additions on the property. | Land | Improvement |
|---|---|---|---|---|
| 2025 | $1,709 | $335,957 | $102,500 | $233,457 |
| 2024 | $1,709 | $329,029 | $97,500 | $231,529 |
| 2023 | $1,788 | $352,396 | $92,500 | $259,896 |
| 2022 | $1,726 | $173,995 | $20,625 | $153,370 |
| 2021 | $1,345 | $193,318 | $37,500 | $155,818 |
| 2020 | $1,190 | $193,318 | $37,500 | $155,818 |
| 2019 | $1,116 | $96,466 | $20,625 | $75,841 |
| 2018 | $1,007 | $86,573 | $20,625 | $65,948 |
| 2017 | $788 | $117,260 | $16,500 | $87,260 |
| 2016 | $827 | $62,208 | $16,500 | $45,708 |
| 2015 | $774 | $58,053 | $16,500 | $41,553 |
| 2014 | $774 | $56,074 | $16,500 | $39,574 |
| 2013 | -- | $56,074 | $16,500 | $39,574 |
Source: Public Records
Map
Nearby Homes