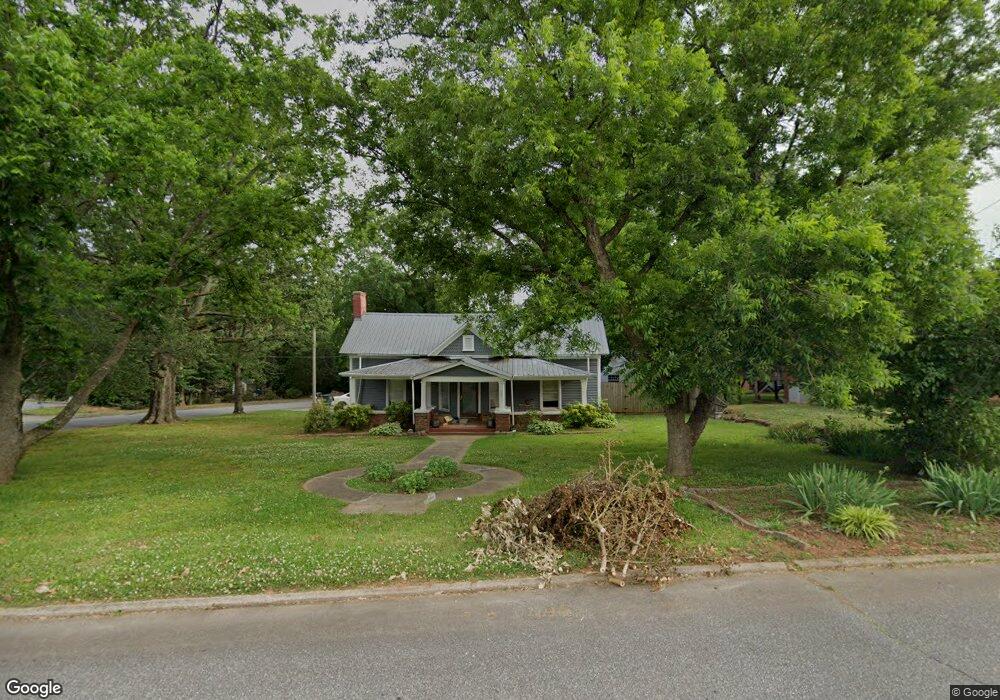
207 W C St Newton, NC 28658
Estimated Value: $193,786 - $210,000
2
Beds
2
Baths
1,341
Sq Ft
$150/Sq Ft
Est. Value
About This Home
This home is located at 207 W C St, Newton, NC 28658 and is currently estimated at $201,447, approximately $150 per square foot. 207 W C St is a home located in Catawba County with nearby schools including South Newton Elementary School, Newton-Conover Middle School, and Newton-Conover High School.
Ownership History
Date
Name
Owned For
Owner Type
Purchase Details
Closed on
May 31, 2005
Sold by
Tomlin Anderson Lee and Tomlin Sheila Whittington
Bought by
Mackie Elizabeth Erin
Current Estimated Value
Home Financials for this Owner
Home Financials are based on the most recent Mortgage that was taken out on this home.
Original Mortgage
$78,500
Outstanding Balance
$39,628
Interest Rate
5.25%
Mortgage Type
Fannie Mae Freddie Mac
Estimated Equity
$161,819
Purchase Details
Closed on
Apr 9, 2001
Purchase Details
Closed on
Dec 1, 1995
Create a Home Valuation Report for This Property
The Home Valuation Report is an in-depth analysis detailing your home's value as well as a comparison with similar homes in the area
Home Values in the Area
Average Home Value in this Area
Purchase History
| Date | Buyer | Sale Price | Title Company |
|---|---|---|---|
| Mackie Elizabeth Erin | $78,500 | None Available | |
| -- | $65,000 | -- | |
| -- | $37,000 | -- |
Source: Public Records
Mortgage History
| Date | Status | Borrower | Loan Amount |
|---|---|---|---|
| Open | Mackie Elizabeth Erin | $78,500 |
Source: Public Records
Tax History Compared to Growth
Tax History
| Year | Tax Paid | Tax Assessment Tax Assessment Total Assessment is a certain percentage of the fair market value that is determined by local assessors to be the total taxable value of land and additions on the property. | Land | Improvement |
|---|---|---|---|---|
| 2025 | $1,407 | $165,800 | $8,500 | $157,300 |
| 2024 | $1,407 | $165,800 | $8,500 | $157,300 |
| 2023 | $1,407 | $165,800 | $8,500 | $157,300 |
| 2022 | $861 | $77,200 | $8,500 | $68,700 |
| 2021 | $861 | $77,200 | $8,500 | $68,700 |
| 2020 | $861 | $77,200 | $8,500 | $68,700 |
| 2019 | $861 | $77,200 | $0 | $0 |
| 2018 | $856 | $76,800 | $8,500 | $68,300 |
| 2017 | $856 | $0 | $0 | $0 |
| 2016 | $856 | $0 | $0 | $0 |
| 2015 | $802 | $76,750 | $8,500 | $68,250 |
| 2014 | $802 | $79,400 | $10,800 | $68,600 |
Source: Public Records
Map
Nearby Homes
- 215 W D St
- 355 S College Ave
- 310 W 4th St
- 103 W Herman St
- 504 N Spring Ave
- 743 S College Ave
- 127 S Caldwell Ave
- 216 N Davis Ave
- 300 N Ervin Ave
- 425 W 8th St
- 509 W 8th St
- 125 S Ervin Ave
- 406 S Caldwell Ave
- 215 S Ervin Ave
- 1241 E I St Unit 20
- 1251 E I St
- 902 N Ashe Ave
- 418 W 9th St
- 204 W 10th St
- 1152 Long Dr