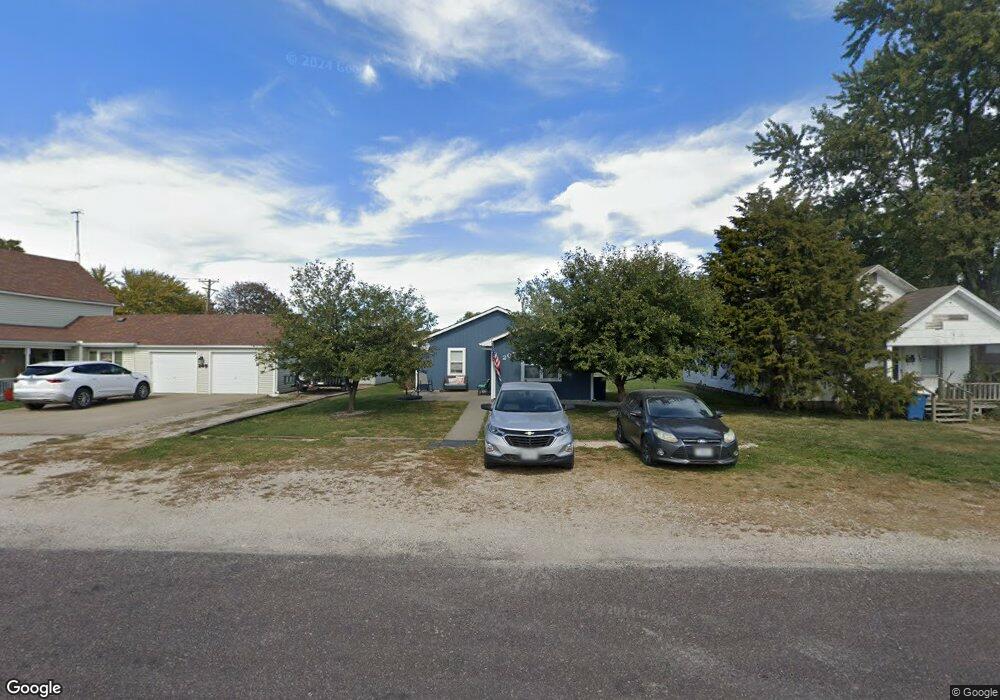
207 W Marlow St Odessa, MO 64076
Estimated Value: $123,000 - $161,000
3
Beds
1
Bath
1,064
Sq Ft
$135/Sq Ft
Est. Value
About This Home
This home is located at 207 W Marlow St, Odessa, MO 64076 and is currently estimated at $143,671, approximately $135 per square foot. 207 W Marlow St is a home with nearby schools including McQuerry Elementary School, Odessa Upper Elementary School, and Odessa Middle School.
Ownership History
Date
Name
Owned For
Owner Type
Purchase Details
Closed on
Aug 28, 2015
Sold by
Weeks Ruby A
Bought by
Bradley Robert Adam and Bradley Candice L
Current Estimated Value
Home Financials for this Owner
Home Financials are based on the most recent Mortgage that was taken out on this home.
Original Mortgage
$295,000
Interest Rate
4.03%
Mortgage Type
Future Advance Clause Open End Mortgage
Purchase Details
Closed on
Aug 12, 2011
Sold by
Bradley James O and Bradley Sandra M
Bought by
Bradley Robert Adam and Bradley Candice L
Create a Home Valuation Report for This Property
The Home Valuation Report is an in-depth analysis detailing your home's value as well as a comparison with similar homes in the area
Home Values in the Area
Average Home Value in this Area
Purchase History
| Date | Buyer | Sale Price | Title Company |
|---|---|---|---|
| Bradley Robert Adam | -- | Midwest Title | |
| Bradley Robert Adam | -- | -- |
Source: Public Records
Mortgage History
| Date | Status | Borrower | Loan Amount |
|---|---|---|---|
| Closed | Bradley Robert Adam | $295,000 |
Source: Public Records
Tax History Compared to Growth
Tax History
| Year | Tax Paid | Tax Assessment Tax Assessment Total Assessment is a certain percentage of the fair market value that is determined by local assessors to be the total taxable value of land and additions on the property. | Land | Improvement |
|---|---|---|---|---|
| 2025 | $774 | $11,660 | $0 | $0 |
| 2024 | $774 | $10,228 | $0 | $0 |
| 2023 | $773 | $10,228 | $0 | $0 |
| 2022 | $765 | $10,228 | $0 | $0 |
| 2021 | $764 | $10,228 | $0 | $0 |
| 2020 | $764 | $10,161 | $0 | $0 |
| 2019 | $762 | $10,161 | $0 | $0 |
| 2018 | $701 | $10,161 | $0 | $0 |
| 2017 | $701 | $10,162 | $0 | $0 |
| 2016 | $567 | $40,950 | $7,050 | $33,900 |
| 2012 | -- | $40,550 | $7,050 | $33,500 |
Source: Public Records
Map
Nearby Homes