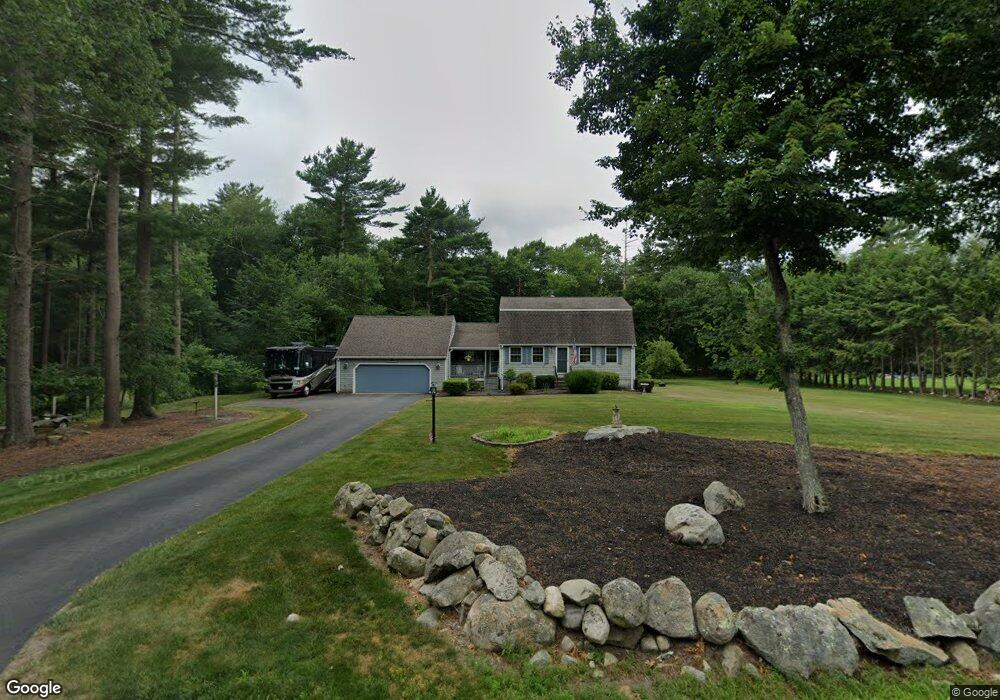
207 Walnut St Bridgewater, MA 02324
Estimated Value: $602,000 - $742,000
3
Beds
2
Baths
2,028
Sq Ft
$337/Sq Ft
Est. Value
About This Home
This home is located at 207 Walnut St, Bridgewater, MA 02324 and is currently estimated at $682,830, approximately $336 per square foot. 207 Walnut St is a home located in Plymouth County with nearby schools including Mitchell Elementary School, Williams Intermediate School, and Bridgewater Middle School.
Ownership History
Date
Name
Owned For
Owner Type
Purchase Details
Closed on
May 14, 2020
Sold by
Jones Kenneth R and Jones Janice A
Bought by
327 Walnut St Rt
Current Estimated Value
Purchase Details
Closed on
Jul 20, 1984
Bought by
Jones Kenneth R and Jones Janice A
Create a Home Valuation Report for This Property
The Home Valuation Report is an in-depth analysis detailing your home's value as well as a comparison with similar homes in the area
Home Values in the Area
Average Home Value in this Area
Purchase History
| Date | Buyer | Sale Price | Title Company |
|---|---|---|---|
| 327 Walnut St Rt | -- | None Available | |
| Jones Kenneth R | $93,600 | -- |
Source: Public Records
Mortgage History
| Date | Status | Borrower | Loan Amount |
|---|---|---|---|
| Previous Owner | Jones Kenneth R | $112,000 | |
| Previous Owner | Jones Kenneth R | $30,000 | |
| Previous Owner | Jones Kenneth R | $145,000 |
Source: Public Records
Tax History
| Year | Tax Paid | Tax Assessment Tax Assessment Total Assessment is a certain percentage of the fair market value that is determined by local assessors to be the total taxable value of land and additions on the property. | Land | Improvement |
|---|---|---|---|---|
| 2025 | $6,879 | $581,500 | $198,700 | $382,800 |
| 2024 | $6,741 | $555,300 | $189,200 | $366,100 |
| 2023 | $6,683 | $520,500 | $176,800 | $343,700 |
| 2022 | $6,544 | $457,000 | $155,100 | $301,900 |
| 2021 | $5,957 | $411,400 | $138,500 | $272,900 |
| 2020 | $5,876 | $398,900 | $133,100 | $265,800 |
| 2019 | $5,613 | $378,500 | $133,100 | $245,400 |
| 2018 | $5,402 | $355,600 | $122,900 | $232,700 |
| 2017 | $5,201 | $333,200 | $122,900 | $210,300 |
| 2016 | $4,968 | $319,700 | $120,500 | $199,200 |
| 2015 | $4,991 | $307,300 | $117,000 | $190,300 |
| 2014 | $4,787 | $294,600 | $107,600 | $187,000 |
Source: Public Records
Map
Nearby Homes
- 3 Caswell Way
- 150 Prattown Ln
- 199 Cherry St
- Lot 1 Mill St
- 211 Cherry St
- 225 Whitman St
- 0 Auburn St
- 215 Whitman St
- 114 Plain St
- 0 Flagg St Unit 73421818
- 398 Plymouth St
- 81 Arrowhead Dr
- 5 Country Dr
- 0 Three Rivers Dr
- 73 Pratt Ave
- 101 Pratt Ave
- 829 Auburn St
- 35 Nelson Dr
- 67 Country Dr
- 11 Satucket Trail
Your Personal Tour Guide
Ask me questions while you tour the home.