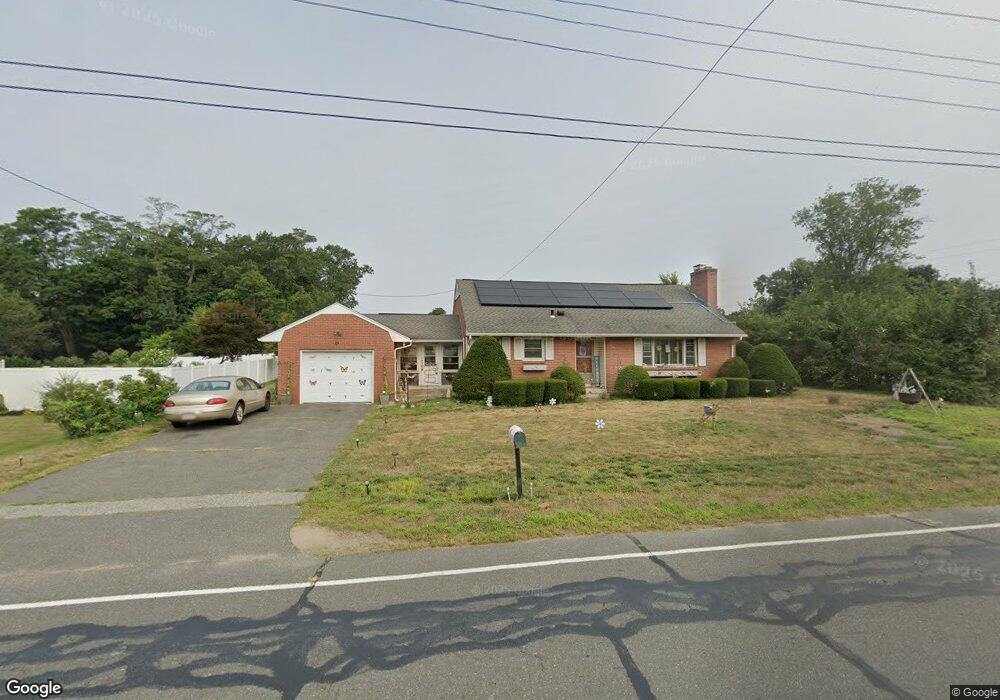
207 West St Ludlow, MA 01056
Estimated Value: $310,000 - $361,000
2
Beds
2
Baths
1,379
Sq Ft
$246/Sq Ft
Est. Value
About This Home
This home is located at 207 West St, Ludlow, MA 01056 and is currently estimated at $339,752, approximately $246 per square foot. 207 West St is a home located in Hampden County with nearby schools including East Street Elementary School, Chapin Street Elementary School, and Paul R. Baird Middle School.
Ownership History
Date
Name
Owned For
Owner Type
Purchase Details
Closed on
Nov 17, 2003
Sold by
Surprenant Dora T
Bought by
Scott John J
Current Estimated Value
Home Financials for this Owner
Home Financials are based on the most recent Mortgage that was taken out on this home.
Original Mortgage
$150,400
Outstanding Balance
$67,701
Interest Rate
5.81%
Mortgage Type
VA
Estimated Equity
$272,051
Create a Home Valuation Report for This Property
The Home Valuation Report is an in-depth analysis detailing your home's value as well as a comparison with similar homes in the area
Home Values in the Area
Average Home Value in this Area
Purchase History
| Date | Buyer | Sale Price | Title Company |
|---|---|---|---|
| Scott John J | $156,000 | -- | |
| Scott John J | $156,000 | -- |
Source: Public Records
Mortgage History
| Date | Status | Borrower | Loan Amount |
|---|---|---|---|
| Open | Scott John J | $150,400 | |
| Closed | Scott John J | $150,400 |
Source: Public Records
Tax History Compared to Growth
Tax History
| Year | Tax Paid | Tax Assessment Tax Assessment Total Assessment is a certain percentage of the fair market value that is determined by local assessors to be the total taxable value of land and additions on the property. | Land | Improvement |
|---|---|---|---|---|
| 2025 | $4,827 | $278,200 | $69,800 | $208,400 |
| 2024 | $4,593 | $253,900 | $69,700 | $184,200 |
| 2023 | $4,349 | $222,900 | $61,200 | $161,700 |
| 2022 | $4,112 | $205,700 | $61,200 | $144,500 |
| 2021 | $4,100 | $194,500 | $61,200 | $133,300 |
| 2020 | $3,926 | $190,400 | $60,200 | $130,200 |
| 2019 | $3,663 | $184,800 | $59,700 | $125,100 |
| 2018 | $3,424 | $180,100 | $59,700 | $120,400 |
| 2017 | $3,356 | $181,100 | $57,900 | $123,200 |
| 2016 | $3,184 | $175,600 | $56,700 | $118,900 |
| 2015 | $3,021 | $174,700 | $56,100 | $118,600 |
Source: Public Records
Map
Nearby Homes