Estimated Value: $134,000 - $172,446
2
Beds
1
Bath
988
Sq Ft
$147/Sq Ft
Est. Value
About This Home
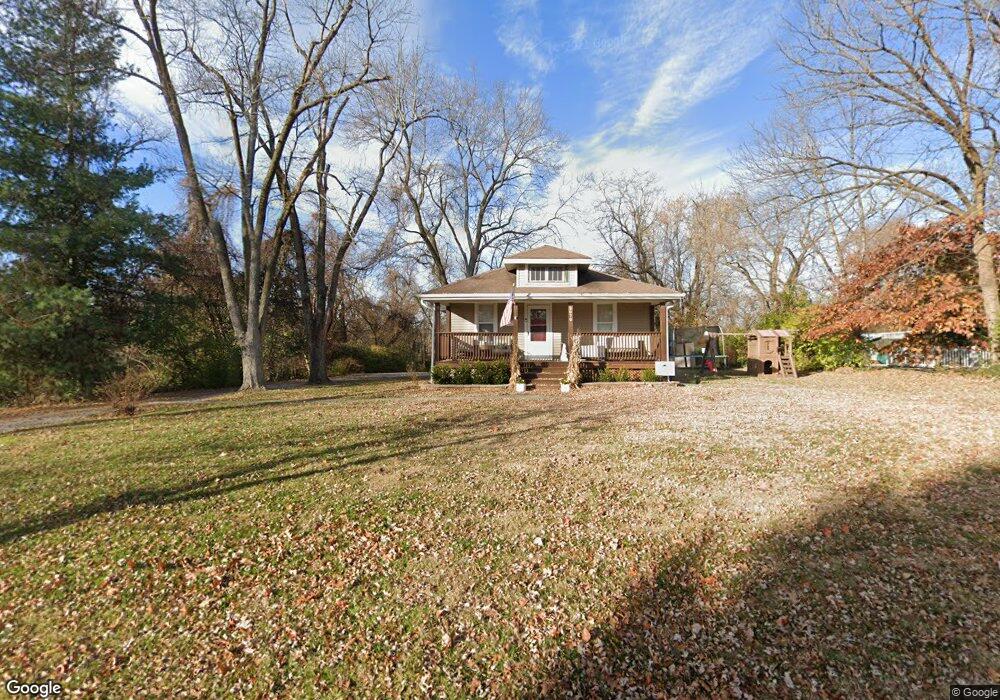
This home is located at 2070 Alby St, Alton, IL 62002 and is currently estimated at $145,612, approximately $147 per square foot. 2070 Alby St is a home located in Madison County with nearby schools including North Elementary School, Alton Middle School, and Alton High School.
Ownership History
Date
Name
Owned For
Owner Type
Purchase Details
Closed on
Apr 20, 2022
Sold by
Banks Brandon L
Bought by
Hughes Afton M and Banks Brandon L
Current Estimated Value
Home Financials for this Owner
Home Financials are based on the most recent Mortgage that was taken out on this home.
Original Mortgage
$54,517
Outstanding Balance
$50,931
Interest Rate
3.75%
Mortgage Type
New Conventional
Estimated Equity
$94,681
Purchase Details
Closed on
Mar 22, 2016
Sold by
Banks Pamela J
Bought by
Banks Brandon L
Purchase Details
Closed on
Mar 31, 2011
Sold by
Middleton Gene R and Middleton Jamie R
Bought by
Banks Pamela J
Create a Home Valuation Report for This Property
The Home Valuation Report is an in-depth analysis detailing your home's value as well as a comparison with similar homes in the area
Home Values in the Area
Average Home Value in this Area
Purchase History
| Date | Buyer | Sale Price | Title Company |
|---|---|---|---|
| Hughes Afton M | -- | Serenity Title & Escrow | |
| Banks Brandon L | -- | Serenity Title & Escrow Ltd | |
| Banks Pamela J | $83,000 | Community Title |
Source: Public Records
Mortgage History
| Date | Status | Borrower | Loan Amount |
|---|---|---|---|
| Open | Hughes Afton M | $54,517 |
Source: Public Records
Tax History Compared to Growth
Tax History
| Year | Tax Paid | Tax Assessment Tax Assessment Total Assessment is a certain percentage of the fair market value that is determined by local assessors to be the total taxable value of land and additions on the property. | Land | Improvement |
|---|---|---|---|---|
| 2024 | $2,175 | $32,760 | $6,890 | $25,870 |
| 2023 | $2,175 | $29,580 | $6,220 | $23,360 |
| 2022 | $1,995 | $26,740 | $5,620 | $21,120 |
| 2021 | $1,752 | $25,130 | $5,280 | $19,850 |
| 2020 | $1,692 | $24,230 | $5,090 | $19,140 |
| 2019 | $1,735 | $23,670 | $4,970 | $18,700 |
| 2018 | $1,679 | $23,050 | $4,840 | $18,210 |
| 2017 | $2,230 | $23,050 | $4,840 | $18,210 |
| 2016 | $2,186 | $23,050 | $4,840 | $18,210 |
| 2015 | $2,077 | $23,050 | $4,840 | $18,210 |
| 2014 | $2,077 | $23,050 | $4,840 | $18,210 |
| 2013 | $2,077 | $23,670 | $4,970 | $18,700 |
Source: Public Records
Map
Nearby Homes