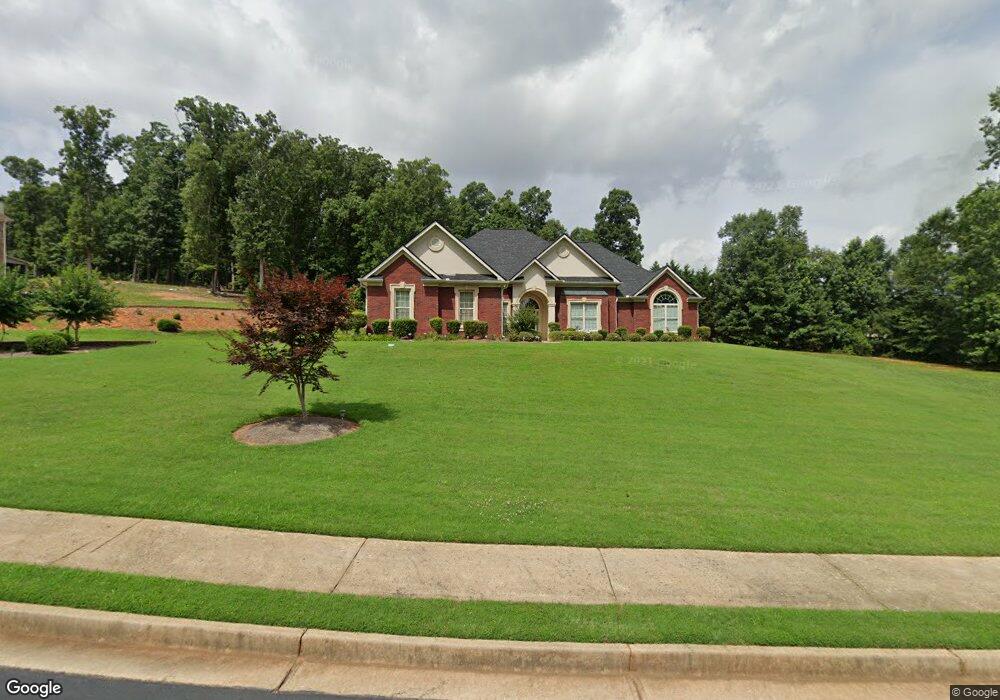
2070 Channing Dr Conyers, GA 30094
Estimated Value: $378,489 - $571,000
5
Beds
4
Baths
3,175
Sq Ft
$151/Sq Ft
Est. Value
About This Home
This home is located at 2070 Channing Dr, Conyers, GA 30094 and is currently estimated at $479,872, approximately $151 per square foot. 2070 Channing Dr is a home located in Rockdale County with nearby schools including Barksdale Elementary School, Gen. Ray Davis Middle School, and Salem High School.
Ownership History
Date
Name
Owned For
Owner Type
Purchase Details
Closed on
Oct 26, 2011
Sold by
Federal National Mortgage Association
Bought by
Verner Joe Ann
Current Estimated Value
Home Financials for this Owner
Home Financials are based on the most recent Mortgage that was taken out on this home.
Original Mortgage
$170,563
Outstanding Balance
$117,591
Interest Rate
4.25%
Mortgage Type
FHA
Estimated Equity
$362,281
Purchase Details
Closed on
Sep 7, 2010
Sold by
Suntrust Mtg Inc
Bought by
Federal Natl Mtg Assn Fnma
Purchase Details
Closed on
Nov 10, 2008
Sold by
Dasilva Alston
Bought by
Dasilva Alston and Hillocks Eartha
Purchase Details
Closed on
Oct 22, 2007
Sold by
Cane Properties Llc
Bought by
Dasilva Alston
Home Financials for this Owner
Home Financials are based on the most recent Mortgage that was taken out on this home.
Original Mortgage
$334,000
Interest Rate
6.37%
Mortgage Type
New Conventional
Create a Home Valuation Report for This Property
The Home Valuation Report is an in-depth analysis detailing your home's value as well as a comparison with similar homes in the area
Home Values in the Area
Average Home Value in this Area
Purchase History
| Date | Buyer | Sale Price | Title Company |
|---|---|---|---|
| Verner Joe Ann | $175,000 | -- | |
| Federal Natl Mtg Assn Fnma | $206,100 | -- | |
| Suntrust Mtg Inc | $206,100 | -- | |
| Dasilva Alston | -- | -- | |
| Dasilva Alston | $334,000 | -- |
Source: Public Records
Mortgage History
| Date | Status | Borrower | Loan Amount |
|---|---|---|---|
| Open | Verner Joe Ann | $170,563 | |
| Previous Owner | Dasilva Alston | $334,000 |
Source: Public Records
Tax History Compared to Growth
Tax History
| Year | Tax Paid | Tax Assessment Tax Assessment Total Assessment is a certain percentage of the fair market value that is determined by local assessors to be the total taxable value of land and additions on the property. | Land | Improvement |
|---|---|---|---|---|
| 2024 | $3,768 | $154,800 | $26,920 | $127,880 |
| 2023 | $2,751 | $120,120 | $26,920 | $93,200 |
| 2022 | $2,706 | $113,920 | $26,920 | $87,000 |
| 2021 | $2,896 | $113,920 | $26,920 | $87,000 |
| 2020 | $2,986 | $112,800 | $25,800 | $87,000 |
| 2019 | $2,858 | $106,240 | $19,240 | $87,000 |
| 2018 | $2,453 | $92,560 | $13,360 | $79,200 |
| 2017 | $2,223 | $84,200 | $13,360 | $70,840 |
| 2016 | $2,056 | $84,200 | $13,360 | $70,840 |
| 2015 | $2,060 | $84,200 | $13,360 | $70,840 |
| 2014 | $1,843 | $84,200 | $13,360 | $70,840 |
| 2013 | -- | $70,000 | $18,106 | $51,894 |
Source: Public Records
Map
Nearby Homes
- 1038 Plantation Blvd SE
- 1061 Plantation Blvd SE
- 303 Landon Dr SE
- 1119 Plantation Dr SE
- 1023 Plantation Ct SE
- 550 Oglesby Bridge Rd SE
- 455 Sweet Water Trail SE
- 605 Trophy Ln
- 385 Oglesby Bridge Rd SE
- 495 Oglesby Bridge Rd SE
- 210 Cowan Rd SE
- 411 Willow Ct SE Unit 3
- 510 Bell Rd SE Unit 1
- 604 Hamlet Ct SE
- 570 Bell Rd SE
- 201 Thorn Berry Way
- 450 Valley Woods Cir SE
- 4797 Hemlock Dr SE
- 530 Valley Woods Cir SE
- 586 Clubland Cir SE
- 2060 Channing Dr Unit 14
- 2060 Channing Dr
- 2063 Channing Dr
- 2074 Channing Dr
- 2071 Channing Dr
- 2056 Channing Dr
- 2059 Channing Dr
- 2078 Channing Dr
- 2075 Channing Dr
- 2055 Channing Dr
- 1054 Plantation Way SE Unit 22
- 1054 Plantation Way SE
- 0 Channing Dr Unit 7372985
- 0 Channing Dr Unit 7341007
- 0 Channing Dr Unit 7287039
- 0 Channing Dr Unit 8654931
- 0 Channing Dr Unit 7050774
- 0 Channing Dr Unit 7380788
- 0 Channing Dr Unit 7159667
- 0 Channing Dr Unit 3107471