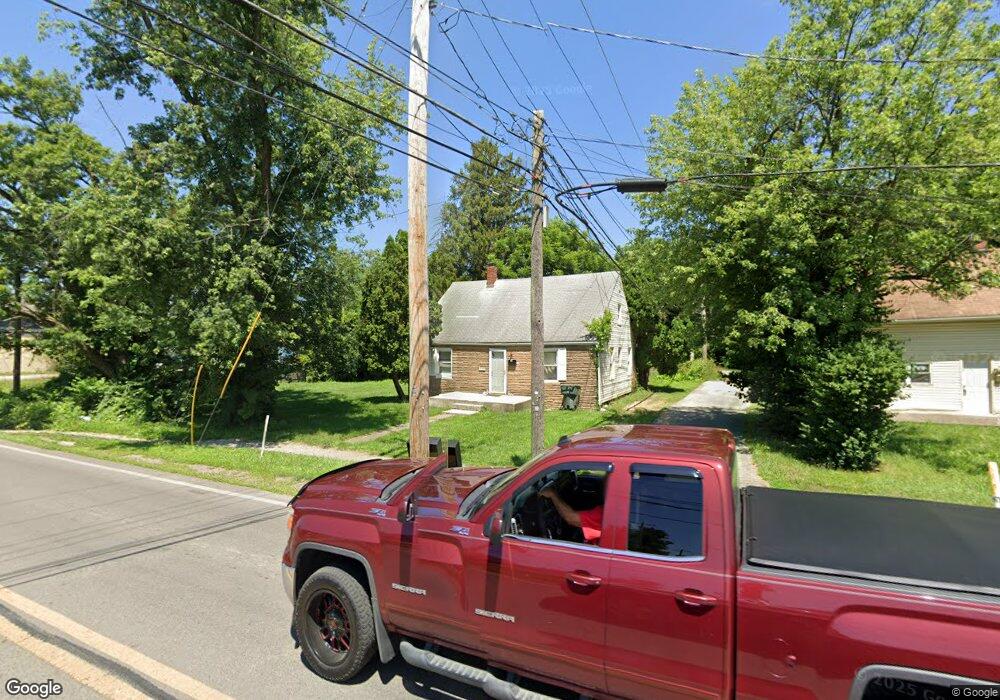
2070 Mock Rd Columbus, OH 43219
Arlington Park NeighborhoodEstimated Value: $157,229 - $188,000
3
Beds
1
Bath
1,191
Sq Ft
$141/Sq Ft
Est. Value
About This Home
This home is located at 2070 Mock Rd, Columbus, OH 43219 and is currently estimated at $167,807, approximately $140 per square foot. 2070 Mock Rd is a home located in Franklin County with nearby schools including East Linden Elementary School, Mifflin Middle School, and Mifflin High School.
Ownership History
Date
Name
Owned For
Owner Type
Purchase Details
Closed on
Dec 3, 2007
Sold by
Martin Management Services Inc
Bought by
Rosewood Holdings Llc
Current Estimated Value
Home Financials for this Owner
Home Financials are based on the most recent Mortgage that was taken out on this home.
Original Mortgage
$51,000
Outstanding Balance
$31,691
Interest Rate
6.3%
Mortgage Type
Purchase Money Mortgage
Estimated Equity
$136,116
Purchase Details
Closed on
Apr 12, 2001
Sold by
Severance Betty L and Estate Of Myrtle M Penrod
Bought by
Green Donald F
Home Financials for this Owner
Home Financials are based on the most recent Mortgage that was taken out on this home.
Original Mortgage
$47,619
Interest Rate
7.03%
Mortgage Type
Purchase Money Mortgage
Purchase Details
Closed on
Jun 27, 1985
Bought by
Penrod Myrtle M
Create a Home Valuation Report for This Property
The Home Valuation Report is an in-depth analysis detailing your home's value as well as a comparison with similar homes in the area
Home Values in the Area
Average Home Value in this Area
Purchase History
| Date | Buyer | Sale Price | Title Company |
|---|---|---|---|
| Rosewood Holdings Llc | $36,000 | Talon Group | |
| Green Donald F | $47,000 | -- | |
| Penrod Myrtle M | -- | -- |
Source: Public Records
Mortgage History
| Date | Status | Borrower | Loan Amount |
|---|---|---|---|
| Open | Rosewood Holdings Llc | $51,000 | |
| Previous Owner | Green Donald F | $47,619 |
Source: Public Records
Tax History
| Year | Tax Paid | Tax Assessment Tax Assessment Total Assessment is a certain percentage of the fair market value that is determined by local assessors to be the total taxable value of land and additions on the property. | Land | Improvement |
|---|---|---|---|---|
| 2025 | $2,167 | $47,290 | $6,130 | $41,160 |
| 2024 | $2,167 | $47,290 | $6,130 | $41,160 |
| 2023 | $2,140 | $47,285 | $6,125 | $41,160 |
| 2022 | $1,149 | $21,630 | $1,610 | $20,020 |
| 2021 | $1,152 | $21,630 | $1,610 | $20,020 |
| 2020 | $1,153 | $21,630 | $1,610 | $20,020 |
| 2019 | $1,321 | $18,830 | $1,400 | $17,430 |
| 2018 | $1,008 | $18,830 | $1,400 | $17,430 |
| 2017 | $1,171 | $18,830 | $1,400 | $17,430 |
| 2016 | $930 | $13,690 | $1,680 | $12,010 |
| 2015 | $847 | $13,690 | $1,680 | $12,010 |
| 2014 | $849 | $13,690 | $1,680 | $12,010 |
| 2013 | $493 | $16,100 | $1,995 | $14,105 |
Source: Public Records
Map
Nearby Homes
- 2003 E Hudson St
- 2054 Jermain Dr
- 0 Parkwood Ave
- 2080 Parkwood Ave Unit 2090
- 2150 Sagamore Rd
- 0 Danby Dr
- 2058 Briarwood Ave
- 1927 Jermain Dr
- 2281 Delbert Rd
- 2227 Marcia Dr
- 2213 Century Dr
- 0 Mock Rd
- 2250 Brentnell Ave
- 1938 Myrtle Ave
- 2448 Parkwood Ave
- 2192 Genessee Ave
- 1805 E 26th Ave
- 2475 Parkwood Ave
- 2422 Joyce Ave
- 1799 Harold Place
Your Personal Tour Guide
Ask me questions while you tour the home.