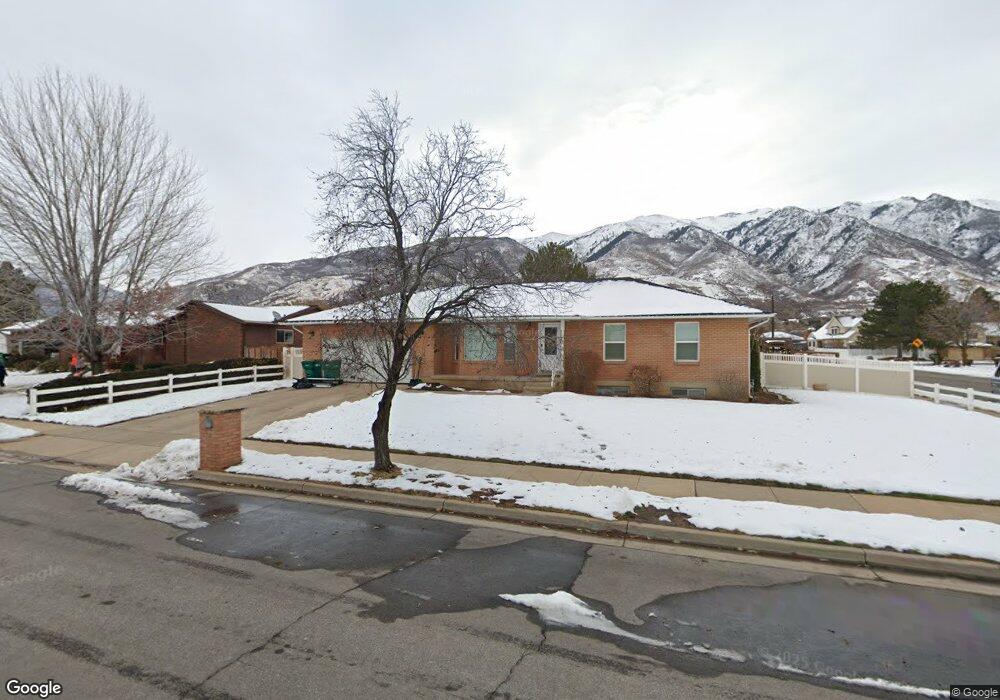
2070 N 2325 E Layton, UT 84040
Estimated Value: $521,000 - $589,115
3
Beds
3
Baths
3,029
Sq Ft
$187/Sq Ft
Est. Value
About This Home
This home is located at 2070 N 2325 E, Layton, UT 84040 and is currently estimated at $566,029, approximately $186 per square foot. 2070 N 2325 E is a home located in Davis County with nearby schools including Sarah Jane Adams Elementary School, North Layton Junior High School, and Northridge High School.
Ownership History
Date
Name
Owned For
Owner Type
Purchase Details
Closed on
Jul 1, 2025
Sold by
Hurst Brooke
Bought by
Hurst Eric
Current Estimated Value
Home Financials for this Owner
Home Financials are based on the most recent Mortgage that was taken out on this home.
Original Mortgage
$300,000
Outstanding Balance
$299,493
Interest Rate
6.86%
Mortgage Type
Credit Line Revolving
Estimated Equity
$266,536
Purchase Details
Closed on
Mar 29, 2010
Sold by
Peterson Boyd C and Peterson Mary L
Bought by
Hurst Eric
Home Financials for this Owner
Home Financials are based on the most recent Mortgage that was taken out on this home.
Original Mortgage
$13,090
Interest Rate
4.88%
Mortgage Type
Stand Alone Second
Purchase Details
Closed on
Mar 26, 2004
Sold by
Hurst Roger F and Carver Patricia H
Bought by
Peterson Boyd C and Peterson Mary L
Home Financials for this Owner
Home Financials are based on the most recent Mortgage that was taken out on this home.
Original Mortgage
$142,800
Interest Rate
5.64%
Mortgage Type
Purchase Money Mortgage
Create a Home Valuation Report for This Property
The Home Valuation Report is an in-depth analysis detailing your home's value as well as a comparison with similar homes in the area
Home Values in the Area
Average Home Value in this Area
Purchase History
| Date | Buyer | Sale Price | Title Company |
|---|---|---|---|
| Hurst Eric | -- | First American Title Insurance | |
| Hurst Eric | -- | First American Title Insurance | |
| Hurst Eric | -- | Bonneville Superior Title Co | |
| Peterson Boyd C | -- | Heritage West Title Ins |
Source: Public Records
Mortgage History
| Date | Status | Borrower | Loan Amount |
|---|---|---|---|
| Open | Hurst Eric | $300,000 | |
| Closed | Hurst Eric | $300,000 | |
| Previous Owner | Hurst Eric | $13,090 | |
| Previous Owner | Hurst Eric | $218,175 | |
| Previous Owner | Peterson Boyd C | $142,800 | |
| Closed | Peterson Boyd C | $26,775 |
Source: Public Records
Tax History
| Year | Tax Paid | Tax Assessment Tax Assessment Total Assessment is a certain percentage of the fair market value that is determined by local assessors to be the total taxable value of land and additions on the property. | Land | Improvement |
|---|---|---|---|---|
| 2025 | $3,010 | $293,150 | $117,602 | $175,548 |
| 2024 | $2,859 | $282,150 | $140,358 | $141,792 |
| 2023 | $2,906 | $511,000 | $189,515 | $321,485 |
| 2022 | $3,011 | $289,300 | $101,632 | $187,668 |
| 2021 | $2,681 | $383,000 | $154,637 | $228,363 |
| 2020 | $2,441 | $334,000 | $125,061 | $208,939 |
| 2019 | $2,374 | $320,000 | $111,750 | $208,250 |
| 2018 | $2,186 | $296,000 | $86,875 | $209,125 |
| 2016 | $2,009 | $142,395 | $48,158 | $94,237 |
| 2015 | $1,981 | $133,980 | $48,158 | $85,822 |
| 2014 | $1,936 | $134,583 | $48,158 | $86,425 |
| 2013 | -- | $121,896 | $25,032 | $96,864 |
Source: Public Records
Map
Nearby Homes
- 2202 N 2300 E
- 1907 N Bridge Ct
- 2509 E 1900 N
- 2547 E 1900 N
- 2340 N 2050 E
- 1954 N 2600 E
- 2391 Kays Creek Dr
- 2273 N 1975 E
- 2563 E 2250 N
- 2189 N 1950 E
- 2597 N 2300 E
- 2136 N 2800 E
- 1843 Hayes Dr
- 2124 E Cherry Ln
- 1975 E 1425 N
- 3142 E Thorley Dr
- 3138 E Thorley Dr
- 2569 N 2900 E
- 1332 N 2350 E
- 1540 E Primrose Ln
Your Personal Tour Guide
Ask me questions while you tour the home.