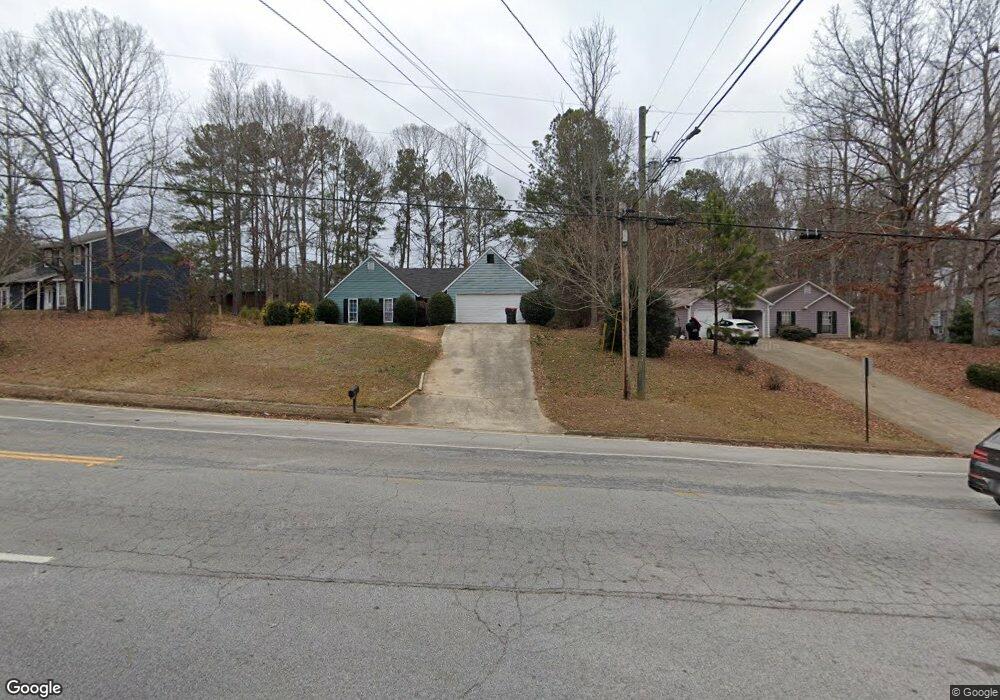
2070 S County Line Rd Unit 15 Lithia Springs, GA 30122
Lithia Springs NeighborhoodEstimated Value: $247,190 - $310,000
2
Beds
2
Baths
1,376
Sq Ft
$199/Sq Ft
Est. Value
About This Home
This home is located at 2070 S County Line Rd Unit 15, Lithia Springs, GA 30122 and is currently estimated at $274,048, approximately $199 per square foot. 2070 S County Line Rd Unit 15 is a home located in Douglas County with nearby schools including Sweetwater Elementary School, Factory Shoals Middle School, and Lithia Springs Comprehensive High School.
Ownership History
Date
Name
Owned For
Owner Type
Purchase Details
Closed on
Sep 25, 2012
Sold by
1St Two Properties Llc
Bought by
Thurman-Parham Mary S
Current Estimated Value
Purchase Details
Closed on
Jul 14, 2009
Sold by
Thurman-Parham Mary S
Bought by
1St-Two Properties Llc
Purchase Details
Closed on
Jan 1, 2007
Sold by
Parham Curtis J
Bought by
Thurman-Parham Mary S
Purchase Details
Closed on
Mar 24, 1995
Sold by
Va
Bought by
Thurman Mary Sue
Purchase Details
Closed on
Aug 2, 1994
Sold by
Express Amer Mort Co
Bought by
Va
Create a Home Valuation Report for This Property
The Home Valuation Report is an in-depth analysis detailing your home's value as well as a comparison with similar homes in the area
Home Values in the Area
Average Home Value in this Area
Purchase History
| Date | Buyer | Sale Price | Title Company |
|---|---|---|---|
| Thurman-Parham Mary S | -- | -- | |
| 1St-Two Properties Llc | -- | -- | |
| Thurman-Parham Mary S | -- | -- | |
| Thurman Mary Sue | $65,500 | -- | |
| Va | -- | -- | |
| Express Amer Mort Co | $57,000 | -- |
Source: Public Records
Mortgage History
| Date | Status | Borrower | Loan Amount |
|---|---|---|---|
| Closed | Thurman Mary Sue | $0 |
Source: Public Records
Tax History Compared to Growth
Tax History
| Year | Tax Paid | Tax Assessment Tax Assessment Total Assessment is a certain percentage of the fair market value that is determined by local assessors to be the total taxable value of land and additions on the property. | Land | Improvement |
|---|---|---|---|---|
| 2024 | $2,353 | $72,720 | $20,640 | $52,080 |
| 2023 | $2,353 | $72,720 | $20,640 | $52,080 |
| 2022 | $2,078 | $72,720 | $20,640 | $52,080 |
| 2021 | $1,589 | $46,720 | $12,480 | $34,240 |
| 2020 | $1,605 | $46,720 | $12,480 | $34,240 |
| 2019 | $1,474 | $45,800 | $12,480 | $33,320 |
| 2018 | $1,253 | $38,480 | $10,800 | $27,680 |
| 2017 | $1,179 | $35,400 | $10,800 | $24,600 |
| 2016 | $1,162 | $34,280 | $10,800 | $23,480 |
| 2015 | $1,161 | $33,520 | $10,800 | $22,720 |
| 2014 | $1,248 | $35,480 | $12,000 | $23,480 |
| 2013 | -- | $35,120 | $12,000 | $23,120 |
Source: Public Records
Map
Nearby Homes
- 3957 Fairhaven Rd
- 3790 Sweetbriar Cir
- 3940 Fairhaven Rd
- HAYDEN Plan at Fairhaven
- GREEN Plan at Fairhaven
- CALI Plan at Fairhaven
- ELLE Plan at Fairhaven
- PENWELL Plan at Fairhaven
- 3924 Fairhaven Rd
- 3948 Fairhaven Rd
- 3686 Sweetbriar Cir
- 3964 Fairhaven Rd
- 2740 Montie Ct
- 2741 Montie Ct
- 2732 Montie Ct
- 3652 Sweetbriar Cir
- 2756 Montie Ct
- 3646 Briar Dr
- 2071 Oakcreek Dr
- 8767 N View Dr
- 2070 S County Line Rd
- 2060 S County Line Rd
- 2080 S County Line Rd
- 2090 S County Line Rd
- 2789 Herring Place
- 2788 Herring Place
- 2037 S County Line Rd
- 2027 S County Line Rd
- 2059 S County Line Rd
- 2745 Melissa Ann Place
- 2795 Herring Place
- 2069 S County Line Rd
- 2794 Herring Place
- 2801 Herring Place
- 2015 S County Line Rd
- 2058 Sanders Place
- 2079 S County Line Rd
- 2068 Sanders Place
- 2768 Melissa Ann Place
- 2807 Herring Place