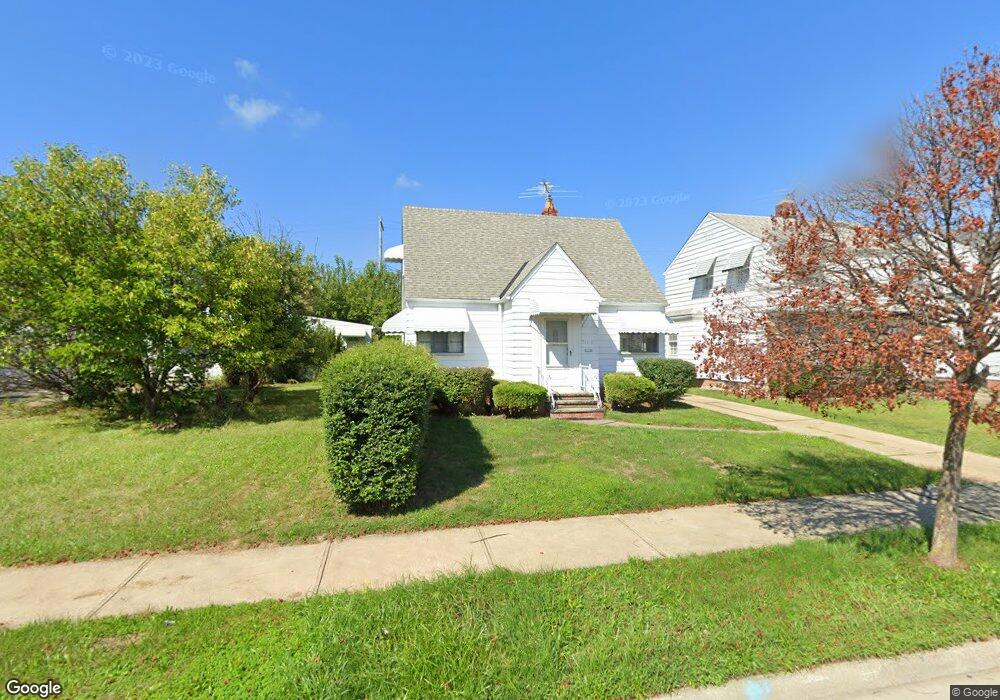
20701 Naumann Ave Euclid, OH 44123
Estimated Value: $115,000 - $125,000
3
Beds
1
Bath
1,082
Sq Ft
$110/Sq Ft
Est. Value
About This Home
This home is located at 20701 Naumann Ave, Euclid, OH 44123 and is currently estimated at $118,502, approximately $109 per square foot. 20701 Naumann Ave is a home located in Cuyahoga County with nearby schools including Arbor Elementary School, Euclid Middle School, and Euclid High School.
Ownership History
Date
Name
Owned For
Owner Type
Purchase Details
Closed on
Sep 4, 2018
Sold by
Tmak Restroation Llc
Bought by
Moran Yochi
Current Estimated Value
Purchase Details
Closed on
Jun 8, 2018
Sold by
Stenger Charles C
Bought by
Tmak Restoration Llc
Home Financials for this Owner
Home Financials are based on the most recent Mortgage that was taken out on this home.
Original Mortgage
$57,789
Interest Rate
4.5%
Mortgage Type
Construction
Purchase Details
Closed on
Jan 25, 2018
Sold by
Stenger Ruth J and Stenger Ruth Josephine
Bought by
Stenger Charles C
Purchase Details
Closed on
Jan 1, 1975
Bought by
Stenger Charles C and Stenger Ruth J
Create a Home Valuation Report for This Property
The Home Valuation Report is an in-depth analysis detailing your home's value as well as a comparison with similar homes in the area
Home Values in the Area
Average Home Value in this Area
Purchase History
| Date | Buyer | Sale Price | Title Company |
|---|---|---|---|
| Moran Yochi | $60,300 | None Available | |
| Tmak Restoration Llc | $20,000 | Cuyahoga Title Services | |
| Stenger Charles C | -- | None Available | |
| Stenger Charles C | -- | -- |
Source: Public Records
Mortgage History
| Date | Status | Borrower | Loan Amount |
|---|---|---|---|
| Previous Owner | Tmak Restoration Llc | $57,789 |
Source: Public Records
Tax History
| Year | Tax Paid | Tax Assessment Tax Assessment Total Assessment is a certain percentage of the fair market value that is determined by local assessors to be the total taxable value of land and additions on the property. | Land | Improvement |
|---|---|---|---|---|
| 2024 | $2,734 | $38,850 | $7,245 | $31,605 |
| 2023 | $1,908 | $21,110 | $3,780 | $17,330 |
| 2022 | $2,095 | $21,110 | $3,780 | $17,330 |
| 2021 | $2,075 | $21,110 | $3,780 | $17,330 |
| 2020 | $1,917 | $17,640 | $4,310 | $13,340 |
| 2019 | $1,723 | $50,400 | $12,300 | $38,100 |
| 2018 | $923 | $17,640 | $4,310 | $13,340 |
| 2017 | $819 | $15,190 | $2,870 | $12,320 |
| 2016 | $821 | $15,190 | $2,870 | $12,320 |
| 2015 | $755 | $15,190 | $2,870 | $12,320 |
| 2014 | $755 | $15,190 | $2,870 | $12,320 |
Source: Public Records
Map
Nearby Homes
- 20830 Tracy Ave
- 20890 Morris Ave
- 21100 Nicholas Ave
- 20801 Morris Ave
- 21130 Arbor Ave
- 20671 Wilmore Ave
- 20751 Wilmore Ave
- 21170 Wilmore Ave
- 21250 Milan Dr
- 21051 Westport Ave
- 560 E 200th St
- 20591 Ball Ave
- 21250 Ball Ave
- 21181 Ball Ave
- 20430 Miller Ave
- 828 E 216th St
- 20261 Fuller Ave
- 20900 Priday Ave
- 19901 Pawnee Ave
- 311 E 197th St
- 20731 Naumann Ave
- 20671 Naumann Ave
- 20751 Naumann Ave
- 20700 Nicholas Ave
- 20730 Nicholas Ave
- 20650 Nicholas Ave
- 20631 Naumann Ave
- 20761 Naumann Ave
- 20750 Nicholas Ave
- 20630 Nicholas Ave
- 20700 Naumann Ave
- 20601 Naumann Ave
- 20771 Naumann Ave
- 20771 Naumann Ave Unit 2
- 20771 Naumann Ave Unit 1
- 20720 Naumann Ave
- 20660 Naumann Ave
- 20750 Naumann Ave
- 20770 Nicholas Ave
- 20650 Naumann Ave
Your Personal Tour Guide
Ask me questions while you tour the home.